Travelers 2014 Annual Report Download - page 90
Download and view the complete annual report
Please find page 90 of the 2014 Travelers annual report below. You can navigate through the pages in the report by either clicking on the pages listed below, or by using the keyword search tool below to find specific information within the annual report.-
 1
1 -
2
-
3
-
4
-
5
-
6
-
7
-
8
-
9
-
10
-
11
-
12
-
13
-
14
-
15
-
16
-
17
-
18
-
19
-
20
-
21
-
22
-
23
-
24
-
25
-
26
-
27
-
28
-
29
-
30
-
31
-
32
-
33
-
34
-
35
-
36
-
37
-
38
-
39
-
40
-
41
-
42
-
43
-
44
-
45
-
46
-
47
-
48
-
49
-
50
-
51
-
52
-
53
-
54
-
55
-
56
-
57
-
58
-
59
-
60
-
61
-
62
-
63
-
64
-
65
-
66
-
67
-
68
-
69
-
70
-
71
-
72
-
73
-
74
-
75
-
76
-
77
-
78
-
79
-
 80
80 -
 81
81 -
 82
82 -
 83
83 -
 84
84 -
 85
85 -
 86
86 -
 87
87 -
 88
88 -
 89
89 -
 90
90 -
 91
91 -
 92
92 -
 93
93 -
 94
94 -
 95
95 -
 96
96 -
 97
97 -
 98
98 -
 99
99 -
 100
100 -
101
-
102
-
103
-
104
-
105
-
106
-
107
-
108
-
109
-
110
-
111
-
112
-
113
-
114
-
115
-
116
-
117
-
118
-
119
-
120
-
121
-
122
-
123
-
124
-
125
-
126
-
127
-
128
-
129
-
130
-
131
-
132
-
133
-
134
-
135
-
136
-
137
-
138
-
139
-
140
-
141
-
142
-
143
-
144
-
145
-
146
-
147
-
148
-
149
-
150
-
151
-
152
-
153
-
154
-
155
-
156
-
157
-
158
-
159
-
160
-
161
-
162
-
163
-
164
-
165
-
166
-
167
-
168
-
169
-
170
-
171
-
172
-
173
-
174
-
175
-
176
-
177
-
178
-
179
-
180
-
181
-
182
-
183
-
184
-
185
-
186
-
187
-
188
-
189
-
190
-
191
-
192
-
193
-
194
-
195
-
196
-
197
-
198
-
199
-
200
-
201
-
202
-
203
-
204
-
205
-
206
-
207
-
208
-
209
-
210
-
211
-
212
-
213
-
214
-
215
-
216
-
217
-
218
-
219
-
220
-
221
-
222
-
223
-
224
-
225
-
226
-
227
-
228
-
229
-
230
-
231
-
232
-
233
-
234
-
235
-
236
-
237
-
238
-
239
-
240
-
241
-
242
-
243
-
244
-
245
-
246
-
247
-
248
-
249
-
250
-
251
-
252
-
253
-
254
-
255
-
256
-
257
-
258
-
259
-
260
-
261
-
262
-
263
-
264
-
265
-
266
-
267
-
268
-
269
-
270
-
271
-
272
-
273
-
274
-
275
-
276
-
277
-
278
-
279
-
280
-
281
-
282
-
283
-
284
-
285
-
286
-
287
-
288
-
289
-
290
-
291
-
292
-
293
-
294
-
295
-
296
-
297
-
298
-
299
-
300
-
301
-
302
-
303
-
304
-
305
-
306
-
307
-
308
-
309
-
310
-
311
-
312
-
313
-
314
-
315
-
316
-
317
-
318
-
319
-
320
-
321
-
322
-
323
-
324
-
325
-
326
-
327
-
328
-
329
-
330
-
331
-
332
-
333
-
334
-
335
-
336
-
337
-
338
-
339
-
340
-
341
-
342
-
343
-
344
-
345
-
346
-
347
-
348
-
349
-
350
-
351
-
352
-
353
-
354
-
355
-
356
-
357
-
358
-
359
-
360
-
361
-
362
-
363
-
364
-
365
-
366
 |
 |

Table of Contents
the corporate tax rate of 35%, comprising a lower percentage of pretax income in 2013 than in 2012, partially offset by the resolution of prior year tax
matters in 2013 described above.
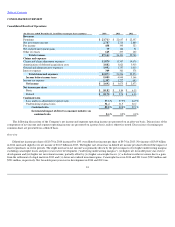
Revenues
Earned Premiums
Earned premiums in 2014 were $14.51 billion, $1.18 billion or 9% higher than in 2013. Earned premiums in 2013 were $13.33 billion, $553 million or
4% higher than in 2012. The increases in both 2014 and 2013 reflected the impact of an increase in net written premiums over the preceding twelve
months. The increase in net written premiums in 2014 was primarily due to the acquisition of Dominion. The increase in net written premiums in 2013
also included, to a lesser extent, the impact of the acquisition of Dominion, which occurred on November 1, 2013.
Net Investment Income
Net investment income in 2014 was $2.16 billion, $69 million or 3% higher than in 2013, primarily reflecting the impact of the acquisition of
Dominion. Net investment income in 2013 was $2.09 billion, $118 million or 5% lower than in 2012. Included in the Business and International
Insurance segment are certain legal entities whose invested assets and related net investment income are reported exclusively in this segment and
not allocated among all business segments. Refer to the "Net Investment Income" section of the "Consolidated Results of Operations" discussion
herein for a description of the factors contributing to the changes in the Company's consolidated net investment income in 2014 and 2013 compared
with the respective prior years. In addition, refer to note 2 of notes to the Company's consolidated financial statements herein for a discussion of
the Company's net investment income allocation methodology.
Fee Income
National Accounts is the primary source of fee income due to its service businesses, which include claim and loss prevention services to large
companies that choose to self
-
insure a portion of their insurance risks, as well as claims and policy management services to workers' compensation
residual market pools. Fee income in 2014 increased by $43 million or 11% over 2013. Fee income in 2013 increased by $72 million or 22% over 2012.
The increases in both years primarily reflected higher serviced premium volume in workers' compensation residual market pools and higher claim
volume in the large deductible business.
Other Revenues
Other revenues in 2013 included a $91 million gain from the settlement of a legal proceeding, which is discussed in more detail in note 16 of
notes to the consolidated financial statements.
Claims and Expenses
Claims and Claim Adjustment Expenses
Claims and claim adjustment expenses in 2014 were $9.15 billion, $860 million or 10% higher than in 2013, primarily reflecting (i) the impact of the
acquisition of Dominion, (ii) the impact of loss cost trends, (iii) higher non
-
catastrophe weather
-
related losses, (iv) a higher level of what the
Company defines as large losses, (v) a decline in net favorable prior year reserve development and (vi) higher catastrophe losses, partially offset by
(vii) the impact of lower volumes of insured exposures (excluding the impact of the acquisition of Dominion). Factors contributing to net favorable
prior year reserve development are discussed in more detail in note 7 of notes to the Company's consolidated financial statements.
89