Travelers 2014 Annual Report Download - page 239
Download and view the complete annual report
Please find page 239 of the 2014 Travelers annual report below. You can navigate through the pages in the report by either clicking on the pages listed below, or by using the keyword search tool below to find specific information within the annual report.-
 1
1 -
2
-
3
-
4
-
5
-
6
-
7
-
8
-
9
-
10
-
11
-
12
-
13
-
14
-
15
-
16
-
17
-
18
-
19
-
20
-
21
-
22
-
23
-
24
-
25
-
26
-
27
-
28
-
29
-
30
-
31
-
32
-
33
-
34
-
35
-
36
-
37
-
38
-
39
-
40
-
41
-
42
-
43
-
44
-
45
-
46
-
47
-
48
-
49
-
50
-
51
-
52
-
53
-
54
-
55
-
56
-
57
-
58
-
59
-
60
-
61
-
62
-
63
-
64
-
65
-
66
-
67
-
68
-
69
-
70
-
71
-
72
-
73
-
74
-
75
-
76
-
77
-
78
-
79
-
80
-
81
-
82
-
83
-
84
-
85
-
86
-
87
-
88
-
89
-
90
-
91
-
92
-
93
-
94
-
95
-
96
-
97
-
98
-
99
-
100
-
101
-
102
-
103
-
104
-
105
-
106
-
107
-
108
-
109
-
110
-
111
-
112
-
113
-
114
-
115
-
116
-
117
-
118
-
119
-
120
-
121
-
122
-
123
-
124
-
125
-
126
-
127
-
128
-
129
-
130
-
131
-
132
-
133
-
134
-
135
-
136
-
137
-
138
-
139
-
140
-
141
-
142
-
143
-
144
-
145
-
146
-
147
-
148
-
149
-
150
-
151
-
152
-
153
-
154
-
155
-
156
-
157
-
158
-
159
-
160
-
161
-
162
-
163
-
164
-
165
-
166
-
167
-
168
-
169
-
170
-
171
-
172
-
173
-
174
-
175
-
176
-
177
-
178
-
179
-
180
-
181
-
182
-
183
-
184
-
185
-
186
-
187
-
188
-
189
-
190
-
191
-
192
-
193
-
194
-
195
-
196
-
197
-
198
-
199
-
200
-
201
-
202
-
203
-
204
-
205
-
206
-
207
-
208
-
209
-
210
-
211
-
212
-
213
-
214
-
215
-
216
-
217
-
218
-
219
-
220
-
221
-
222
-
223
-
224
-
225
-
226
-
227
-
228
-
 229
229 -
 230
230 -
 231
231 -
 232
232 -
 233
233 -
 234
234 -
 235
235 -
 236
236 -
 237
237 -
 238
238 -
 239
239 -
 240
240 -
 241
241 -
 242
242 -
 243
243 -
 244
244 -
 245
245 -
 246
246 -
 247
247 -
 248
248 -
 249
249 -
250
-
251
-
252
-
253
-
254
-
255
-
256
-
257
-
258
-
259
-
260
-
261
-
262
-
263
-
264
-
265
-
266
-
267
-
268
-
269
-
270
-
271
-
272
-
273
-
274
-
275
-
276
-
277
-
278
-
279
-
280
-
281
-
282
-
283
-
284
-
285
-
286
-
287
-
288
-
289
-
290
-
291
-
292
-
293
-
294
-
295
-
296
-
297
-
298
-
299
-
300
-
301
-
302
-
303
-
304
-
305
-
306
-
307
-
308
-
309
-
310
-
311
-
312
-
313
-
314
-
315
-
316
-
317
-
318
-
319
-
320
-
321
-
322
-
323
-
324
-
325
-
326
-
327
-
328
-
329
-
330
-
331
-
332
-
333
-
334
-
335
-
336
-
337
-
338
-
339
-
340
-
341
-
342
-
343
-
344
-
345
-
346
-
347
-
348
-
349
-
350
-
351
-
352
-
353
-
354
-
355
-
356
-
357
-
358
-
359
-
360
-
361
-
362
-
363
-
364
-
365
-
366
 |
 |

Table of Contents
THE TRAVELERS COMPANIES, INC. AND SUBSIDIARIES
NOTES TO CONSOLIDATED FINANCIAL STATEMENTS (Continued)
14. PENSION PLANS, RETIREMENT BENEFITS AND SAVINGS PLANS (Continued)
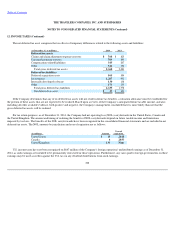
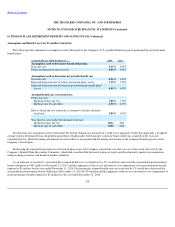
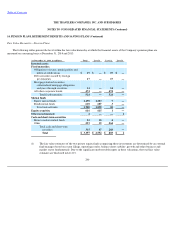
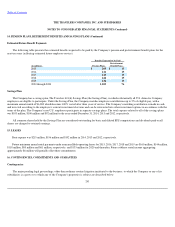
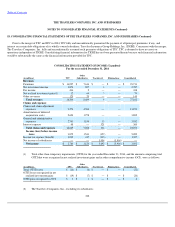
Assumptions and Health Care Cost Trend Rate Sensitivity
The following table summarizes assumptions used with regard to the Company's U.S. qualified domestic pension plan and the postretirement
benefit plans.
The discount rate assumption used to determine the benefit obligation was based on a yield
-
curve approach. Under this approach, a weighted
average yield is determined from a hypothetical portfolio of high quality fixed maturity corporate bonds (rated Aa) available at the year
-
end
valuation date for which the timing and amount of cash outflows correspond with the timing and amount of the estimated benefit payouts of the
Company's benefit plan.
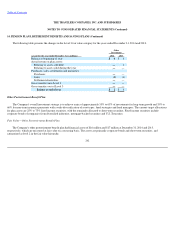
In choosing the expected long
-
term rate of return on plan assets, the Company selected the rate that was set as the return objective by the
Company's Benefit Plans Investment Committee, which had considered the historical returns of equity and fixed maturity markets in conjunction
with prevailing economic and financial market conditions.
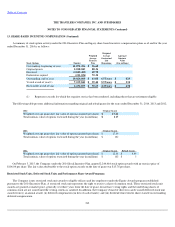
As an indicator of sensitivity, increasing the assumed health care cost trend rate by 1% would have increased the accumulated postretirement
benefit obligation by $29 million at December 31, 2014, and the aggregate of the service and interest cost components of net postretirement benefit
expense by $1 million for the year ended December 31, 2014. Decreasing the assumed health care cost trend rate by 1% would have decreased the
accumulated postretirement benefit obligation at December 31, 2014 by $24 million and the aggregate of the service and interest cost components of
net postretirement benefit expense by $1 million for the year ended December 31, 2014.
238
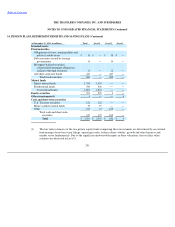
(at and for the year ended December 31,)
2014
2013
Assumptions used to determine benefit obligations
Discount rate
4.10
%
4.96
%
Future compensation increase rate
4.00
%
4.00
%
Assumptions used to determine net periodic benefit cost
Discount rate
4.96
%
4.15
%
Expected long
-
term rate of return on pension plans' assets
7.50
%
7.50
%
Expected long
-
term rate of return on postretirement benefit plans'
assets
4.00
%
4.00
%
Assumed health care cost trend rates
Following year:
Medical (before age 65)
7.00
%
7.25
%
Medical (age 65 and older)
6.50
%
6.75
%
Rate to which the cost trend rate is assumed to decline (ultimate
trend rate)
5.00
%
5.00
%
Year that the rate reaches the ultimate trend rate:
Medical (before age 65)
2022
2022
Medical (age 65 and older)
2020
2020