Travelers 2014 Annual Report Download - page 127
Download and view the complete annual report
Please find page 127 of the 2014 Travelers annual report below. You can navigate through the pages in the report by either clicking on the pages listed below, or by using the keyword search tool below to find specific information within the annual report.-
 1
1 -
2
-
3
-
4
-
5
-
6
-
7
-
8
-
9
-
10
-
11
-
12
-
13
-
14
-
15
-
16
-
17
-
18
-
19
-
20
-
21
-
22
-
23
-
24
-
25
-
26
-
27
-
28
-
29
-
30
-
31
-
32
-
33
-
34
-
35
-
36
-
37
-
38
-
39
-
40
-
41
-
42
-
43
-
44
-
45
-
46
-
47
-
48
-
49
-
50
-
51
-
52
-
53
-
54
-
55
-
56
-
57
-
58
-
59
-
60
-
61
-
62
-
63
-
64
-
65
-
66
-
67
-
68
-
69
-
70
-
71
-
72
-
73
-
74
-
75
-
76
-
77
-
78
-
79
-
80
-
81
-
82
-
83
-
84
-
85
-
86
-
87
-
88
-
89
-
90
-
91
-
92
-
93
-
94
-
95
-
96
-
97
-
98
-
99
-
100
-
101
-
102
-
103
-
104
-
105
-
106
-
107
-
108
-
109
-
110
-
111
-
112
-
113
-
114
-
115
-
116
-
 117
117 -
 118
118 -
 119
119 -
 120
120 -
 121
121 -
 122
122 -
 123
123 -
 124
124 -
 125
125 -
 126
126 -
 127
127 -
 128
128 -
 129
129 -
 130
130 -
 131
131 -
 132
132 -
 133
133 -
 134
134 -
 135
135 -
 136
136 -
 137
137 -
138
-
139
-
140
-
141
-
142
-
143
-
144
-
145
-
146
-
147
-
148
-
149
-
150
-
151
-
152
-
153
-
154
-
155
-
156
-
157
-
158
-
159
-
160
-
161
-
162
-
163
-
164
-
165
-
166
-
167
-
168
-
169
-
170
-
171
-
172
-
173
-
174
-
175
-
176
-
177
-
178
-
179
-
180
-
181
-
182
-
183
-
184
-
185
-
186
-
187
-
188
-
189
-
190
-
191
-
192
-
193
-
194
-
195
-
196
-
197
-
198
-
199
-
200
-
201
-
202
-
203
-
204
-
205
-
206
-
207
-
208
-
209
-
210
-
211
-
212
-
213
-
214
-
215
-
216
-
217
-
218
-
219
-
220
-
221
-
222
-
223
-
224
-
225
-
226
-
227
-
228
-
229
-
230
-
231
-
232
-
233
-
234
-
235
-
236
-
237
-
238
-
239
-
240
-
241
-
242
-
243
-
244
-
245
-
246
-
247
-
248
-
249
-
250
-
251
-
252
-
253
-
254
-
255
-
256
-
257
-
258
-
259
-
260
-
261
-
262
-
263
-
264
-
265
-
266
-
267
-
268
-
269
-
270
-
271
-
272
-
273
-
274
-
275
-
276
-
277
-
278
-
279
-
280
-
281
-
282
-
283
-
284
-
285
-
286
-
287
-
288
-
289
-
290
-
291
-
292
-
293
-
294
-
295
-
296
-
297
-
298
-
299
-
300
-
301
-
302
-
303
-
304
-
305
-
306
-
307
-
308
-
309
-
310
-
311
-
312
-
313
-
314
-
315
-
316
-
317
-
318
-
319
-
320
-
321
-
322
-
323
-
324
-
325
-
326
-
327
-
328
-
329
-
330
-
331
-
332
-
333
-
334
-
335
-
336
-
337
-
338
-
339
-
340
-
341
-
342
-
343
-
344
-
345
-
346
-
347
-
348
-
349
-
350
-
351
-
352
-
353
-
354
-
355
-
356
-
357
-
358
-
359
-
360
-
361
-
362
-
363
-
364
-
365
-
366
 |
 |

Table of Contents
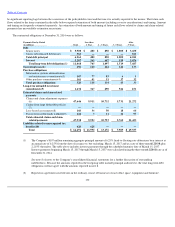
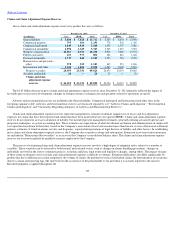
The Company utilized uncollateralized letters of credit issued by major banks with an aggregate limit of approximately $118 million, to provide a
portion of the capital needed to support its obligations at Lloyd's at December 31, 2014. If uncollateralized letters of credit are not available at a
reasonable price or at all in the future, the Company can collateralize these letters of credit or may have to seek alternative means of supporting its
obligations at Lloyd's, which could include utilizing holding company funds on hand.
Operating Activities
Net cash flows provided by operating activities were $3.69 billion, $3.82 billion and $3.23 billion in 2014, 2013 and 2012, respectively. Cash
flows in 2014 primarily reflected higher levels of payments for claims and claim adjustment expenses, general and administrative expenses and
commission expenses, as well as higher income tax payments, partially offset by higher levels of collected premiums. These increases included the
impact of the Company's acquisition of Dominion. Cash flows in 2013 primarily reflected a decrease in losses paid related to catastrophes and a
higher level of collected premiums, partially offset by an increase in income tax payments. Cash flows in 2012 primarily reflected a decrease in losses
paid related to catastrophes, a lower level of paid losses related to asbestos claims and operations in runoff and a higher level of collected
premiums, partially offset by an increase in paid losses related to non
-
catastrophe ongoing business (including the impact of increased loss costs).
In 2014 and 2012, the Company voluntarily made contributions totaling $200 million and $217 million, respectively, to its qualified domestic pension
plan. In 2013, the Company made no contributions to its qualified domestic pension plan. The qualified domestic pension plan was 96% and 106%
funded at December 31, 2014 and 2013, respectively.
Investing Activities
Net cash flows provided by investing activities in 2014 were $206 million, compared with net cash flows used in investing activities of
$910 million and $972 million in 2013 and 2012, respectively. The 2013 total included $997 million related to the Company's acquisition of Dominion
(net of cash acquired). The Company's consolidated total investments at December 31, 2014 increased by $101 million, or less than 1% over year
-
end 2013, primarily reflecting the impact of net cash flows provided by operating activities and an increase in net unrealized appreciation of
investments, largely offset by common share repurchases and dividends paid to shareholders. The Company's consolidated total investments at
December 31, 2013 decreased by $678 million, or 1% over year
-
end 2012, primarily reflecting the impact of a significant decline in net unrealized
appreciation of investments driven by an increase in interest rates, common share repurchases and dividends paid to shareholders, partially offset
by net cash flows provided by operating activities and the acquisition of Dominion.
On December 5, 2012, the Company increased its ownership in J. Malucelli Participações em Seguros e Resseguros S.A, its Brazilian joint
venture (JMalucelli), through the exercise of a pre
-
existing option. As a result, the Company increased its ownership to 49.5% of the venture.
JMalucelli is currently the market leader in surety in Brazil based on market share. The Company's investment was funded with cash provided
internally from an operating subsidiary of the Company.
The Company's investment portfolio is managed to support its insurance operations; accordingly, the portfolio is positioned to meet
obligations to policyholders. As such, the primary goals of the Company's asset
-
liability management process are to satisfy the insurance liabilities
and maintain sufficient liquidity to cover fluctuations in projected liability cash flows. Generally, the expected principal and interest payments
produced by the Company's fixed maturity portfolio adequately fund the estimated runoff of the Company's insurance reserves. Although this is
not an exact cash flow match in each period, the substantial amount by which the market value of the fixed maturity portfolio exceeds the value of
the net insurance liabilities, as well as the positive cash flow from newly sold policies and the large amount of high quality liquid bonds,
contributes to the Company's ability to fund claim payments without having to sell illiquid assets or access credit facilities.
126