Time Warner Cable 2010 Annual Report Download - page 71
Download and view the complete annual report
Please find page 71 of the 2010 Time Warner Cable annual report below. You can navigate through the pages in the report by either clicking on the pages listed below, or by using the keyword search tool below to find specific information within the annual report.-
 1
1 -
2
-
3
-
4
-
5
-
6
-
7
-
8
-
9
-
10
-
11
-
12
-
13
-
14
-
15
-
16
-
17
-
18
-
19
-
20
-
21
-
22
-
23
-
24
-
25
-
26
-
27
-
28
-
29
-
30
-
31
-
32
-
33
-
34
-
35
-
36
-
37
-
38
-
39
-
40
-
41
-
42
-
43
-
44
-
45
-
46
-
47
-
48
-
49
-
50
-
51
-
52
-
53
-
54
-
55
-
56
-
57
-
58
-
59
-
60
-
 61
61 -
 62
62 -
 63
63 -
 64
64 -
 65
65 -
 66
66 -
 67
67 -
 68
68 -
 69
69 -
 70
70 -
 71
71 -
 72
72 -
 73
73 -
 74
74 -
 75
75 -
 76
76 -
 77
77 -
 78
78 -
 79
79 -
 80
80 -
 81
81 -
82
-
83
-
84
-
85
-
86
-
87
-
88
-
89
-
90
-
91
-
92
-
93
-
94
-
95
-
96
-
97
-
98
-
99
-
100
-
101
-
102
-
103
-
104
-
105
-
106
-
107
-
108
-
109
-
110
-
111
-
112
-
113
-
114
-
115
-
116
-
117
-
118
-
119
-
120
-
121
-
122
-
123
-
124
-
125
-
126
-
127
-
128
-
129
-
130
-
131
-
132
-
133
-
134
-
135
-
136
-
137
-
138
-
139
-
140
-
141
-
142
-
143
-
144
-
145
-
146
-
147
-
148
-
149
-
150
-
151
-
152
 |
 |

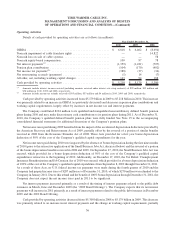
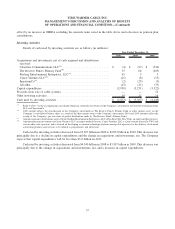
Financing Activities
Details of cash provided (used) by financing activities are as follows (in millions):
2010 2009 2008
Year Ended December 31,
Borrowings (repayments), net
(a)
.................................. $ (1,261) $ 1,261 $ (206)
Borrowings ................................................ 1,872 12,037 7,182
Repayments ................................................ (8) (8,677) (2,817)
Debt issuance costs........................................... (25) (34) (97)
Proceeds from exercise of stock options ........................... 113 4 —
Dividends paid .............................................. (576) — —
Repurchases of common stock .................................. (472) — —
Payment of special cash dividend ................................ — (10,856) —
Other financing activities ...................................... 10 (8) (5)
Cash provided (used) by financing activities . ....................... $ (347) $ (6,273) $ 4,057
(a)
Borrowings (repayments), net, reflects borrowings under the Company’s commercial paper program with original maturities of three months or
less, net of repayments of such borrowings.
Cash used by financing activities was $347 million in 2010 compared to $6.273 billion in 2009. Cash used by
financing activities in 2010 primarily included net repayments under the Company’s commercial paper program, the
payment of quarterly cash dividends and repurchases of TWC common stock, partially offset by the net proceeds of the
2010 Bond Offering and the net proceeds from the exercise of stock options. Cash used by financing activities in 2009
primarily included the payment of the special cash dividend in connection with the Separation, partially offset by the net
proceeds of the 2009 Bond Offerings (after repayment of other debt).
Cash used by financing activities was $6.273 billion in 2009 compared to cash provided by financing activities of
$4.057 billion in 2008. Cash used by financing activities in 2009 primarily included the payment of the special cash
dividend in connection with the Separation, partially offset by the net proceeds of the 2009 Bond Offerings (after
repayment of other debt). Cash provided by financing activities in 2008 primarily included the net proceeds from the 2008
Bond Offerings, partially offset by repayments under the $5.875 billion Revolving Credit Facility and commercial paper
program, the repayment of TWE’s 7.25% debentures due September 1, 2008 (aggregate principal amount of $600 million)
and debt issuance costs relating to the 2008 Bond Offerings and the 2008 Bridge Facility.
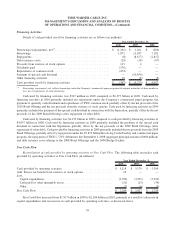
Free Cash Flow
Reconciliation of cash provided by operating activities to Free Cash Flow. The following table reconciles cash
provided by operating activities to Free Cash Flow (in millions):
2010 2009 2008
Year Ended December 31,
Cash provided by operating activities ............................... $ 5,218 $ 5,179 $ 5,300
Add: Excess tax benefit from exercise of stock options .................. 19 — —
Less:
Capital expenditures .......................................... (2,930) (3,231) (3,522)
Cash paid for other intangible assets .............................. (21) (25) (34)
Other ..................................................... (2) (6) (5)
Free Cash Flow ............................................... $ 2,284 $ 1,917 $ 1,739
Free Cash Flow increased from $1.917 billion in 2009 to $2.284 billion in 2010, primarily as a result of a decrease in
capital expenditures and an increase in cash provided by operating activities, as discussed above.
59
TIME WARNER CABLE INC.
MANAGEMENT’S DISCUSSION AND ANALYSIS OF RESULTS
OF OPERATIONS AND FINANCIAL CONDITION—(Continued)