Time Warner Cable 2010 Annual Report Download - page 55
Download and view the complete annual report
Please find page 55 of the 2010 Time Warner Cable annual report below. You can navigate through the pages in the report by either clicking on the pages listed below, or by using the keyword search tool below to find specific information within the annual report.-
 1
1 -
2
-
3
-
4
-
5
-
6
-
7
-
8
-
9
-
10
-
11
-
12
-
13
-
14
-
15
-
16
-
17
-
18
-
19
-
20
-
21
-
22
-
23
-
24
-
25
-
26
-
27
-
28
-
29
-
30
-
31
-
32
-
33
-
34
-
35
-
36
-
37
-
38
-
39
-
40
-
41
-
42
-
43
-
44
-
 45
45 -
 46
46 -
 47
47 -
 48
48 -
 49
49 -
 50
50 -
 51
51 -
 52
52 -
 53
53 -
 54
54 -
 55
55 -
 56
56 -
 57
57 -
 58
58 -
 59
59 -
 60
60 -
 61
61 -
 62
62 -
 63
63 -
 64
64 -
 65
65 -
66
-
67
-
68
-
69
-
70
-
71
-
72
-
73
-
74
-
75
-
76
-
77
-
78
-
79
-
80
-
81
-
82
-
83
-
84
-
85
-
86
-
87
-
88
-
89
-
90
-
91
-
92
-
93
-
94
-
95
-
96
-
97
-
98
-
99
-
100
-
101
-
102
-
103
-
104
-
105
-
106
-
107
-
108
-
109
-
110
-
111
-
112
-
113
-
114
-
115
-
116
-
117
-
118
-
119
-
120
-
121
-
122
-
123
-
124
-
125
-
126
-
127
-
128
-
129
-
130
-
131
-
132
-
133
-
134
-
135
-
136
-
137
-
138
-
139
-
140
-
141
-
142
-
143
-
144
-
145
-
146
-
147
-
148
-
149
-
150
-
151
-
152
 |
 |

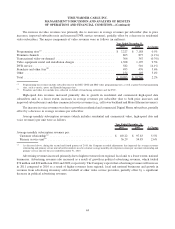
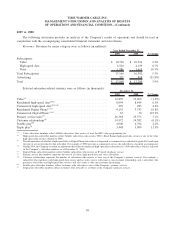
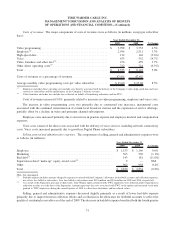
Selected subscriber-related statistics were as follows (in thousands):
2010 2009 % Change
December 31,
Residential video
(a)(b)
............................................... 12,257 12,699 (3.5%)
Commercial video
(b)
................................................ 165 160 3.1%
Residential high-speed data
(c)(d)
........................................ 9,469 8,994 5.3%
Commercial high-speed data
(a)(c)(d)
..................................... 334 295 13.2%
Residential Digital Phone
(d)(e)
......................................... 4,385 4,153 5.6%
Commercial Digital Phone
(a)(d)(e)
....................................... 111 67 65.7%
Primary service units
(a)(f)
............................................. 26,721 26,368 1.3%
Customer relationships
(a)(g)
........................................... 14,496 14,572 (0.5%)
Double play
(a)(h)
................................................... 4,866 4,900 (0.7%)
Triple play
(a)(i)
.................................................... 3,680 3,448 6.7%
(a)
During the second and fourth quarters of 2010, the Company recorded adjustments that, in total, (a) increased certain subscriber numbers, as
follows: residential video subscribers, 12,000; primary service units, 9,000; customer relationships, 60,000; and triple play subscribers, 5,000;
and (b) decreased certain subscriber numbers, as follows: commercial high-speed data subscribers, 1,000; commercial Digital Phone subscribers,
2,000; and double play subscribers, 63,000. These net adjustments are reflected in the Company’s subscriber numbers as of December 31, 2010;
however, they are not reflected in net additions (declines) for the year ended December 31, 2010.
(b)
Video subscriber numbers reflect billable subscribers who receive at least the BST video programming tier. The determination of whether a video
subscriber is categorized as residential or commercial is based on the type of subscriber receiving the service.
(c)
High-speed data subscriber numbers reflect billable subscribers who receive TWC’s Road Runner high-speed data service or any of the other
high-speed data services offered by TWC.
(d)
The determination of whether a high-speed data or Digital Phone subscriber is categorized as commercial or residential is generally based upon
the type of service provided to that subscriber. For example, if TWC provides a commercial service, the subscriber is classified as commercial.
(e)
Digital Phone subscriber numbers reflect billable subscribers who receive an IP-based telephony service.
(f)
Primary service unit numbers represent the total of all video, high-speed data and voice subscribers.
(g)
Customer relationships represent the number of subscribers who receive at least one of the Company’s primary services. For example, a
subscriber who purchases only high-speed data service and no video service will count as one customer relationship, and a subscriber who
purchases both video and high-speed data services will also count as only one customer relationship.
(h)
Double play subscriber numbers reflect customers who subscribe to two of the Company’s primary services.
(i)
Triple play subscriber numbers reflect customers who subscribe to all three of the Company’s primary services.
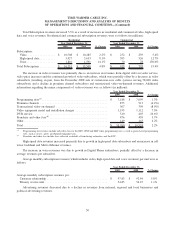
Total Subscription revenues increased 4.8% as a result of increases in residential and commercial video, high-speed
data and voice revenues. Residential and commercial subscription revenues were as follows (in millions):
2010 2009 % Change 2010 2009 % Change
Year Ended December 31,
Residential
Year Ended December 31,
Commercial
Subscription:
Video ................. $ 10,727 $ 10,508 2.1% $ 268 $ 252 6.3%
High-speed data .......... 4,247 3,927 8.1% 713 593 20.2%
Voice.................. 1,905 1,816 4.9% 127 70 81.4%
Total Subscription .......... $ 16,879 $ 16,251 3.9% $ 1,108 $ 915 21.1%
43
TIME WARNER CABLE INC.
MANAGEMENT’S DISCUSSION AND ANALYSIS OF RESULTS
OF OPERATIONS AND FINANCIAL CONDITION—(Continued)