Time Warner Cable 2010 Annual Report Download - page 63
Download and view the complete annual report
Please find page 63 of the 2010 Time Warner Cable annual report below. You can navigate through the pages in the report by either clicking on the pages listed below, or by using the keyword search tool below to find specific information within the annual report.-
 1
1 -
2
-
3
-
4
-
5
-
6
-
7
-
8
-
9
-
10
-
11
-
12
-
13
-
14
-
15
-
16
-
17
-
18
-
19
-
20
-
21
-
22
-
23
-
24
-
25
-
26
-
27
-
28
-
29
-
30
-
31
-
32
-
33
-
34
-
35
-
36
-
37
-
38
-
39
-
40
-
41
-
42
-
43
-
44
-
45
-
46
-
47
-
48
-
49
-
50
-
51
-
52
-
 53
53 -
 54
54 -
 55
55 -
 56
56 -
 57
57 -
 58
58 -
 59
59 -
 60
60 -
 61
61 -
 62
62 -
 63
63 -
 64
64 -
 65
65 -
 66
66 -
 67
67 -
 68
68 -
 69
69 -
 70
70 -
 71
71 -
 72
72 -
 73
73 -
74
-
75
-
76
-
77
-
78
-
79
-
80
-
81
-
82
-
83
-
84
-
85
-
86
-
87
-
88
-
89
-
90
-
91
-
92
-
93
-
94
-
95
-
96
-
97
-
98
-
99
-
100
-
101
-
102
-
103
-
104
-
105
-
106
-
107
-
108
-
109
-
110
-
111
-
112
-
113
-
114
-
115
-
116
-
117
-
118
-
119
-
120
-
121
-
122
-
123
-
124
-
125
-
126
-
127
-
128
-
129
-
130
-
131
-
132
-
133
-
134
-
135
-
136
-
137
-
138
-
139
-
140
-
141
-
142
-
143
-
144
-
145
-
146
-
147
-
148
-
149
-
150
-
151
-
152
 |
 |

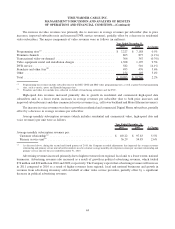
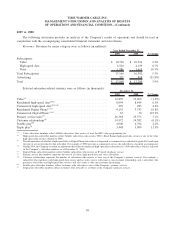
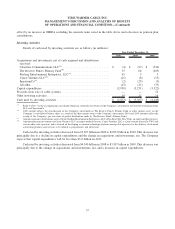
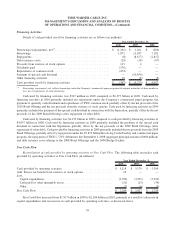
Costs of revenues. The major components of costs of revenues were as follows (in millions, except per subscriber
data):
2009 2008 % Change
Year Ended December 31,
Video programming ......................................... $ 3,998 $ 3,753 6.5%
Employee
(a)
............................................... 2,594 2,511 3.3%
High-speed data . . .......................................... 132 146 (9.6%)
Voice .................................................... 633 552 14.7%
Video franchise and other fees
(b)
................................ 476 459 3.7%
Other direct operating costs
(a)
.................................. 722 724 (0.3%)
Total .................................................... $ 8,555 $ 8,145 5.0%
Costs of revenues as a percentage of revenues...................... 47.9% 47.4%
Average monthly video programming costs per video subscriber ........ $25.60 $ 23.60 8.5%
(a)
Employee and other direct operating costs include costs directly associated with the delivery of the Company’s video, high-speed data and voice
services to subscribers and the maintenance of the Company’s delivery systems.
(b)
Video franchise and other fees include fees collected on behalf of franchising authorities and the FCC.
Costs of revenues increased 5.0%, primarily related to increases in video programming, employee and voice costs.
The increase in video programming costs was primarily due to contractual rate increases, incremental costs
associated with the continued retransmission of certain local broadcast stations and the expansion of service offerings,
partially offset by a decline in video and premium channel subscriptions.
Employee costs increased primarily due to an increase in pension expense and employee medical and compensation
expenses.
Voice costs consist of the direct costs associated with the delivery of voice services, including network connectivity
costs. Voice costs increased primarily due to growth in Digital Phone subscribers.
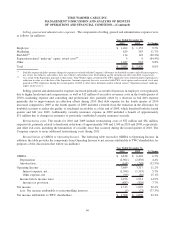
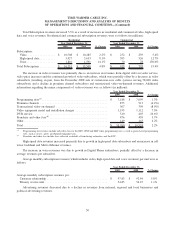
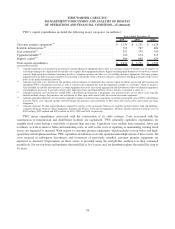
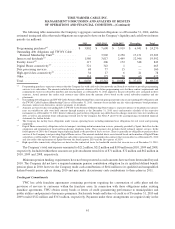
Selling, general and administrative expenses. The components of selling, general and administrative expenses were
as follows (in millions):
2009 2008 % Change
Year Ended December 31,
Employee .................................................... $ 1,153 $ 1,146 0.6%
Marketing .................................................... 563 569 (1.1%)
Bad debt
(a)
................................................... 143 181 (21.0%)
Separation-related “make-up” equity award costs
(b)
...................... 9 — NM
Other ....................................................... 962 958 0.4%
Total ........................................................ $ 2,830 $ 2,854 (0.8%)
NM—Not meaningful.
(a)
Bad debt expense includes amounts charged to expense associated with the Company’s allowance for doubtful accounts and collection expenses,
net of late fees billed to subscribers. Late fees billed to subscribers were $118 million and $106 million in 2009 and 2008, respectively.
(b)
As a result of the Separation, pursuant to their terms, Time Warner equity awards held by TWC employees were forfeited and/or experienced a
reduction in value as of the date of the Separation. Amount represents the costs associated with TWC stock options and restricted stock units
granted to TWC employees during the second quarter of 2009 to offset these forfeitures and/or reduced values.
Selling, general and administrative expenses decreased slightly primarily as a result of lower bad debt expense
primarily due to improvement in collection efforts and a reduction in the allowance for doubtful accounts to reflect the
quality of residential receivables as of the end of 2009. The decrease in bad debt expense benefited both the fourth quarter
51
TIME WARNER CABLE INC.
MANAGEMENT’S DISCUSSION AND ANALYSIS OF RESULTS
OF OPERATIONS AND FINANCIAL CONDITION—(Continued)