Time Warner Cable 2010 Annual Report Download - page 67
Download and view the complete annual report
Please find page 67 of the 2010 Time Warner Cable annual report below. You can navigate through the pages in the report by either clicking on the pages listed below, or by using the keyword search tool below to find specific information within the annual report.-
 1
1 -
2
-
3
-
4
-
5
-
6
-
7
-
8
-
9
-
10
-
11
-
12
-
13
-
14
-
15
-
16
-
17
-
18
-
19
-
20
-
21
-
22
-
23
-
24
-
25
-
26
-
27
-
28
-
29
-
30
-
31
-
32
-
33
-
34
-
35
-
36
-
37
-
38
-
39
-
40
-
41
-
42
-
43
-
44
-
45
-
46
-
47
-
48
-
49
-
50
-
51
-
52
-
53
-
54
-
55
-
56
-
 57
57 -
 58
58 -
 59
59 -
 60
60 -
 61
61 -
 62
62 -
 63
63 -
 64
64 -
 65
65 -
 66
66 -
 67
67 -
 68
68 -
 69
69 -
 70
70 -
 71
71 -
 72
72 -
 73
73 -
 74
74 -
 75
75 -
 76
76 -
 77
77 -
78
-
79
-
80
-
81
-
82
-
83
-
84
-
85
-
86
-
87
-
88
-
89
-
90
-
91
-
92
-
93
-
94
-
95
-
96
-
97
-
98
-
99
-
100
-
101
-
102
-
103
-
104
-
105
-
106
-
107
-
108
-
109
-
110
-
111
-
112
-
113
-
114
-
115
-
116
-
117
-
118
-
119
-
120
-
121
-
122
-
123
-
124
-
125
-
126
-
127
-
128
-
129
-
130
-
131
-
132
-
133
-
134
-
135
-
136
-
137
-
138
-
139
-
140
-
141
-
142
-
143
-
144
-
145
-
146
-
147
-
148
-
149
-
150
-
151
-
152
 |
 |

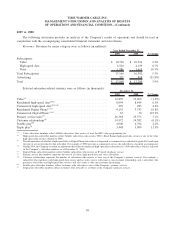
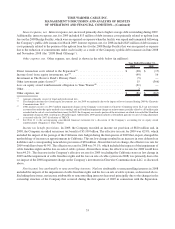
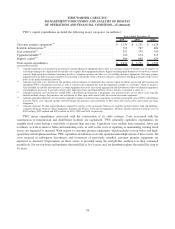
The following table shows the significant items contributing to the change in net debt from December 31, 2009 to
December 31, 2010 (in millions):
Balance as of December 31, 2009 ..................................................... $ 21,283
Cash provided by operating activities ................................................... (5,218)
Capital expenditures ............................................................... 2,930
Dividends paid ................................................................... 576
Increase in the fair value of debt subject to interest rate swap contracts
(a)
........................ 188
Repurchases of common stock ........................................................ 472
Proceeds from exercise of stock options ................................................. (113)
All other, net ..................................................................... (44)
Balance as of December 31, 2010 ..................................................... $ 20,074
(a)
The increase in the fair value of debt subject to interest rate swap contracts is equal to the increase in the fair value of the underlying swaps, which
are separately recorded as assets in the accompanying consolidated balance sheet. See Note 11 to the accompanying consolidated financial
statements for a discussion of the Company’s accounting for its interest rate swap contracts.
In 2008, TWC filed a shelf registration statement on Form S-3 with the Securities and Exchange Commission (the
“SEC”) that allows TWC to offer and sell from time to time senior and subordinated debt securities and debt warrants.
On October 29, 2010, TWC’s Board of Directors authorized the Stock Repurchase Program. From the program’s
inception through February 15, 2011, the Company repurchased 13.9 million shares of TWC common stock for
$916 million.
On January 26, 2011, TWC’s Board of Directors declared a quarterly cash dividend of $0.48 per share of TWC
common stock, payable in cash on March 15, 2011 to stockholders of record at the close of business on February 28, 2011.
As discussed above, on February 1, 2011, TWC entered into an agreement to acquire NaviSite for $5.50 per share of
NaviSite common stock in cash, or a total equity value of approximately $230 million. As of February 1, 2011, NaviSite
had approximately $50 million of debt and approximately $35 million of preferred equity. The transaction, which is
subject to NaviSite stockholder approval, certain regulatory approvals and customary closing conditions, is expected to
close in the second quarter of 2011.
Cash Flows
Cash and equivalents increased $1.999 billion and $5.217 billion in 2010 and 2008, respectively, and decreased
$4.401 billion in 2009. Components of these changes are discussed below in more detail.
55
TIME WARNER CABLE INC.
MANAGEMENT’S DISCUSSION AND ANALYSIS OF RESULTS
OF OPERATIONS AND FINANCIAL CONDITION—(Continued)