Time Warner Cable 2010 Annual Report Download - page 140
Download and view the complete annual report
Please find page 140 of the 2010 Time Warner Cable annual report below. You can navigate through the pages in the report by either clicking on the pages listed below, or by using the keyword search tool below to find specific information within the annual report.-
 1
1 -
2
-
3
-
4
-
5
-
6
-
7
-
8
-
9
-
10
-
11
-
12
-
13
-
14
-
15
-
16
-
17
-
18
-
19
-
20
-
21
-
22
-
23
-
24
-
25
-
26
-
27
-
28
-
29
-
30
-
31
-
32
-
33
-
34
-
35
-
36
-
37
-
38
-
39
-
40
-
41
-
42
-
43
-
44
-
45
-
46
-
47
-
48
-
49
-
50
-
51
-
52
-
53
-
54
-
55
-
56
-
57
-
58
-
59
-
60
-
61
-
62
-
63
-
64
-
65
-
66
-
67
-
68
-
69
-
70
-
71
-
72
-
73
-
74
-
75
-
76
-
77
-
78
-
79
-
80
-
81
-
82
-
83
-
84
-
85
-
86
-
87
-
88
-
89
-
90
-
91
-
92
-
93
-
94
-
95
-
96
-
97
-
98
-
99
-
100
-
101
-
102
-
103
-
104
-
105
-
106
-
107
-
108
-
109
-
110
-
111
-
112
-
113
-
114
-
115
-
116
-
117
-
118
-
119
-
120
-
121
-
122
-
123
-
124
-
125
-
126
-
127
-
128
-
129
-
 130
130 -
 131
131 -
 132
132 -
 133
133 -
 134
134 -
 135
135 -
 136
136 -
 137
137 -
 138
138 -
 139
139 -
 140
140 -
 141
141 -
 142
142 -
 143
143 -
 144
144 -
 145
145 -
 146
146 -
 147
147 -
 148
148 -
 149
149 -
 150
150 -
151
-
152
 |
 |

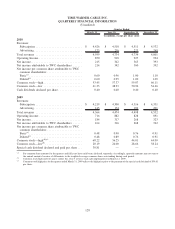
TIME WARNER CABLE INC.
QUARTERLY FINANCIAL INFORMATION
(Unaudited)
March 31, June 30, September 30, December 31,
Quarter Ended
(in millions, except per share data)
2010
Revenues:
Subscription ............................. $ 4,426 $ 4,518 $ 4,511 $ 4,532
Advertising .............................. 173 216 223 269
Total revenues ............................. 4,599 4,734 4,734 4,801
Operating Income ........................... 850 918 927 994
Net income................................ 215 342 363 393
Net income attributable to TWC shareholders ...... 214 342 360 392
Net income per common share attributable to TWC
common shareholders: ......................
Basic
(a)
................................. 0.60 0.96 1.00 1.10
Diluted
(a)
............................... 0.60 0.95 1.00 1.09
Common stock—high ........................ 53.45 57.37 59.07 66.11
Common stock—low ........................ 41.33 48.93 50.96 54.66
Cash dividends declared per share ............... 0.40 0.40 0.40 0.40
2009
Revenues:
Subscription ............................. $ 4,219 $ 4,300 $ 4,316 $ 4,331
Advertising .............................. 145 174 182 201
Total revenues ............................. 4,364 4,474 4,498 4,532
Operating Income ........................... 716 882 828 891
Net income................................ 184 317 268 323
Net income attributable to TWC shareholders ...... 164 316 268 322
Net income per common share attributable to TWC
common shareholders: ......................
Basic
(a)
................................. 0.48 0.90 0.76 0.91
Diluted
(a)
............................... 0.48 0.89 0.76 0.91
Common stock—high
(b)(c)
..................... 68.22 36.25 44.01 44.09
Common stock—low
(b)
....................... 20.19 24.00 28.66 38.24
Special cash dividend declared and paid per share . . . 30.81 — — —
(a)
Per common share amounts for the quarters and full years have each been calculated separately. Accordingly, quarterly amounts may not sum to
the annual amounts because of differences in the weighted-average common shares outstanding during each period.
(b)
Common stock high and low prices reflect the 1-for-3 reverse stock split implemented on March 12, 2009.
(c)
Common stock high price for the quarter ended March 31, 2009 reflects the high price prior to the payment of the special cash dividend of $30.81
per share.
128