Time Warner Cable 2010 Annual Report Download - page 57
Download and view the complete annual report
Please find page 57 of the 2010 Time Warner Cable annual report below. You can navigate through the pages in the report by either clicking on the pages listed below, or by using the keyword search tool below to find specific information within the annual report.-
 1
1 -
2
-
3
-
4
-
5
-
6
-
7
-
8
-
9
-
10
-
11
-
12
-
13
-
14
-
15
-
16
-
17
-
18
-
19
-
20
-
21
-
22
-
23
-
24
-
25
-
26
-
27
-
28
-
29
-
30
-
31
-
32
-
33
-
34
-
35
-
36
-
37
-
38
-
39
-
40
-
41
-
42
-
43
-
44
-
45
-
46
-
 47
47 -
 48
48 -
 49
49 -
 50
50 -
 51
51 -
 52
52 -
 53
53 -
 54
54 -
 55
55 -
 56
56 -
 57
57 -
 58
58 -
 59
59 -
 60
60 -
 61
61 -
 62
62 -
 63
63 -
 64
64 -
 65
65 -
 66
66 -
 67
67 -
68
-
69
-
70
-
71
-
72
-
73
-
74
-
75
-
76
-
77
-
78
-
79
-
80
-
81
-
82
-
83
-
84
-
85
-
86
-
87
-
88
-
89
-
90
-
91
-
92
-
93
-
94
-
95
-
96
-
97
-
98
-
99
-
100
-
101
-
102
-
103
-
104
-
105
-
106
-
107
-
108
-
109
-
110
-
111
-
112
-
113
-
114
-
115
-
116
-
117
-
118
-
119
-
120
-
121
-
122
-
123
-
124
-
125
-
126
-
127
-
128
-
129
-
130
-
131
-
132
-
133
-
134
-
135
-
136
-
137
-
138
-
139
-
140
-
141
-
142
-
143
-
144
-
145
-
146
-
147
-
148
-
149
-
150
-
151
-
152
 |
 |

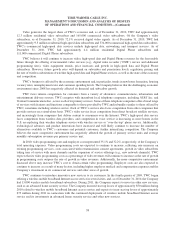
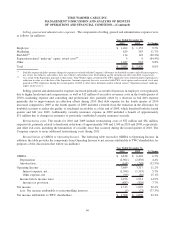
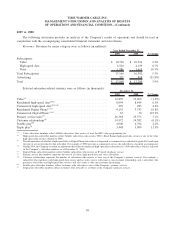
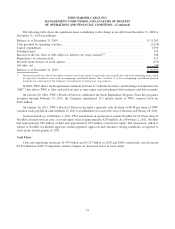
Costs of revenues. The major components of costs of revenues were as follows (in millions, except per subscriber
data):
2010 2009 % Change
Year Ended December 31,
Video programming ............................................. $ 4,213 $ 3,998 5.4%
Employee
(a)
................................................... 2,600 2,594 0.2%
High-speed data ................................................ 136 132 3.0%
Voice........................................................ 669 633 5.7%
Video franchise and other fees
(b)
................................... 493 476 3.6%
Other direct operating costs
(a)
...................................... 830 722 15.0%
Total ........................................................ $ 8,941 $ 8,555 4.5%
Costs of revenues as a percentage of revenues ......................... 47.4% 47.9%
Average monthly video programming costs per video subscriber ............ $ 27.70 $ 25.60 8.2%
(a)
Employee and other direct operating costs include costs directly associated with the delivery of the Company’s video, high-speed data and voice
services to subscribers and the maintenance of the Company’s delivery systems.
(b)
Video franchise and other fees include fees collected on behalf of franchising authorities and the FCC.
Costs of revenues increased 4.5% primarily related to increases in video programming, voice and other direct
operating costs.
The increase in video programming costs was primarily due to contractual rate increases and incremental costs
associated with retransmission of certain local broadcast stations, partially offset by a decline in video subscribers.
Additionally, video programming costs in 2010 and 2009 were reduced by approximately $25 million and $5 million,
respectively, due to changes in cost estimates for programming services carried without a contract, reversals of previously
accrued programming audit reserves and certain contract settlements. The Company expects the rate of growth in total
video programming costs in 2011 to be comparable to that of 2010.
Employee costs increased slightly primarily as a result of higher costs associated with commercial service-related
employees, partially offset by a decline in residential service-related employee costs, primarily resulting from decreased
activity, and a decrease in pension expense.
Voice costs consist of the direct costs associated with the delivery of voice services, including network connectivity
costs. Voice costs for 2010 increased primarily due to growth in Digital Phone subscribers. In the fourth quarter of 2010,
the Company began replacing Sprint Nextel Corporation (“Sprint”) as the provider of Digital Phone transport, switching
and interconnection services, a process that is expected to continue through the first quarter of 2014. As a result, the
Company expects average voice costs per voice subscriber to decrease in 2011 compared to 2010.
Other direct operating costs increased as a result of increases in a number of categories, including costs associated
with advertising inventory sold on behalf of other video service providers, wireless mobile broadband service costs,
computer software and maintenance costs and fuel expense.
Also, during the fourth quarter of 2010, the Company reclassified as other direct operating costs approximately
$20 million that was previously recorded as depreciation expense. Approximately $15 million of this amount relates to
prior quarters in 2010. The Company has not made the comparable reclassification to prior year amounts and management
does not believe this reclassification is material to the current year or prior year results.
45
TIME WARNER CABLE INC.
MANAGEMENT’S DISCUSSION AND ANALYSIS OF RESULTS
OF OPERATIONS AND FINANCIAL CONDITION—(Continued)