Time Warner Cable 2010 Annual Report Download - page 56
Download and view the complete annual report
Please find page 56 of the 2010 Time Warner Cable annual report below. You can navigate through the pages in the report by either clicking on the pages listed below, or by using the keyword search tool below to find specific information within the annual report.-
 1
1 -
2
-
3
-
4
-
5
-
6
-
7
-
8
-
9
-
10
-
11
-
12
-
13
-
14
-
15
-
16
-
17
-
18
-
19
-
20
-
21
-
22
-
23
-
24
-
25
-
26
-
27
-
28
-
29
-
30
-
31
-
32
-
33
-
34
-
35
-
36
-
37
-
38
-
39
-
40
-
41
-
42
-
43
-
44
-
45
-
 46
46 -
 47
47 -
 48
48 -
 49
49 -
 50
50 -
 51
51 -
 52
52 -
 53
53 -
 54
54 -
 55
55 -
 56
56 -
 57
57 -
 58
58 -
 59
59 -
 60
60 -
 61
61 -
 62
62 -
 63
63 -
 64
64 -
 65
65 -
 66
66 -
67
-
68
-
69
-
70
-
71
-
72
-
73
-
74
-
75
-
76
-
77
-
78
-
79
-
80
-
81
-
82
-
83
-
84
-
85
-
86
-
87
-
88
-
89
-
90
-
91
-
92
-
93
-
94
-
95
-
96
-
97
-
98
-
99
-
100
-
101
-
102
-
103
-
104
-
105
-
106
-
107
-
108
-
109
-
110
-
111
-
112
-
113
-
114
-
115
-
116
-
117
-
118
-
119
-
120
-
121
-
122
-
123
-
124
-
125
-
126
-
127
-
128
-
129
-
130
-
131
-
132
-
133
-
134
-
135
-
136
-
137
-
138
-
139
-
140
-
141
-
142
-
143
-
144
-
145
-
146
-
147
-
148
-
149
-
150
-
151
-
152
 |
 |

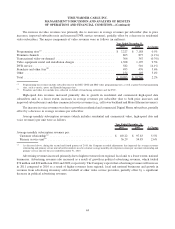
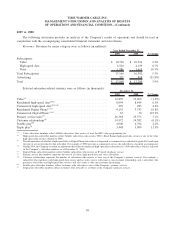
The increase in video revenues was primarily due to increases in average revenues per subscriber (due to price
increases, improved subscriber mix and increased DVR service revenues), partially offset by a decrease in residential
video subscribers. The major components of video revenues were as follows (in millions):
2010 2009 % Change
Year Ended December 31,
Programming tiers
(a)
............................................ $ 7,227 $ 7,188 0.5%
Premium channels .............................................. 865 875 (1.1%)
Transactional video-on-demand .................................... 366 367 (0.3%)
Video equipment rental and installation charges ........................ 1,308 1,195 9.5%
DVR service .................................................. 582 510 14.1%
Franchise and other fees
(b)
........................................ 493 476 3.6%
Other ....................................................... 154 149 3.4%
Total ........................................................ $ 10,995 $ 10,760 2.2%
(a)
Programming tier revenues include subscriber fees for the BST, CPST and DBT video programming tiers, as well as genre-based programming
tiers, such as movie, sports and Spanish-language tiers.
(b)
Franchise and other fees include fees collected on behalf of franchising authorities and the FCC.
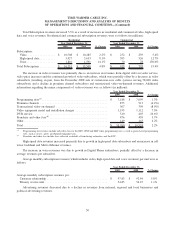
High-speed data revenues increased primarily due to growth in residential and commercial high-speed data
subscribers and, to a lesser extent, increases in average revenues per subscriber (due to both price increases and
improved subscriber mix) and other commercial service revenues (e.g., cell tower backhaul and Metro Ethernet revenues).
The increase in voice revenues was due to growth in residential and commercial Digital Phone subscribers, partially
offset by a decrease in average revenues per subscriber.
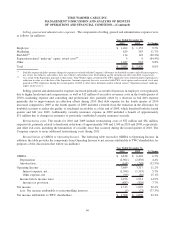
Average monthly subscription revenues (which includes residential and commercial video, high-speed data and
voice revenues) per unit were as follows:
2010 2009 % Change
Year Ended December 31,
Average monthly subscription revenues per:
Customer relationship
(a)
....................................... $ 103.22 $ 97.83 5.5%
Primary service unit
(a)
........................................ 56.29 54.85 2.6%
(a)
As discussed above, during the second and fourth quarters of 2010, the Company recorded adjustments that impacted the average customer
relationship and primary service unit subscriber numbers used to calculate average monthly subscription revenues per customer relationship and
primary service unit for the year ended December 31, 2010.
Advertising revenues increased primarily due to higher revenues from regional, local and, to a lesser extent, national
businesses. Advertising revenues also increased as a result of growth in political advertising revenues, which totaled
$74 million and $20 million in 2010 and 2009, respectively. The Company expects that advertising revenues will increase
in 2011 compared to 2010 as a result of higher revenues from regional, local and national businesses and growth in
revenues from advertising inventory sold on behalf of other video service providers, partially offset by a significant
decrease in political advertising revenues.
44
TIME WARNER CABLE INC.
MANAGEMENT’S DISCUSSION AND ANALYSIS OF RESULTS
OF OPERATIONS AND FINANCIAL CONDITION—(Continued)