Time Warner Cable 2010 Annual Report Download - page 138
Download and view the complete annual report
Please find page 138 of the 2010 Time Warner Cable annual report below. You can navigate through the pages in the report by either clicking on the pages listed below, or by using the keyword search tool below to find specific information within the annual report.-
 1
1 -
2
-
3
-
4
-
5
-
6
-
7
-
8
-
9
-
10
-
11
-
12
-
13
-
14
-
15
-
16
-
17
-
18
-
19
-
20
-
21
-
22
-
23
-
24
-
25
-
26
-
27
-
28
-
29
-
30
-
31
-
32
-
33
-
34
-
35
-
36
-
37
-
38
-
39
-
40
-
41
-
42
-
43
-
44
-
45
-
46
-
47
-
48
-
49
-
50
-
51
-
52
-
53
-
54
-
55
-
56
-
57
-
58
-
59
-
60
-
61
-
62
-
63
-
64
-
65
-
66
-
67
-
68
-
69
-
70
-
71
-
72
-
73
-
74
-
75
-
76
-
77
-
78
-
79
-
80
-
81
-
82
-
83
-
84
-
85
-
86
-
87
-
88
-
89
-
90
-
91
-
92
-
93
-
94
-
95
-
96
-
97
-
98
-
99
-
100
-
101
-
102
-
103
-
104
-
105
-
106
-
107
-
108
-
109
-
110
-
111
-
112
-
113
-
114
-
115
-
116
-
117
-
118
-
119
-
120
-
121
-
122
-
123
-
124
-
125
-
126
-
127
-
 128
128 -
 129
129 -
 130
130 -
 131
131 -
 132
132 -
 133
133 -
 134
134 -
 135
135 -
 136
136 -
 137
137 -
 138
138 -
 139
139 -
 140
140 -
 141
141 -
 142
142 -
 143
143 -
 144
144 -
 145
145 -
 146
146 -
 147
147 -
 148
148 -
149
-
150
-
151
-
152
 |
 |

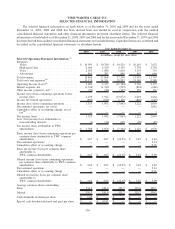
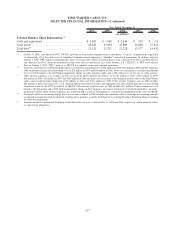
TIME WARNER CABLE INC.
SELECTED FINANCIAL INFORMATION
The selected financial information set forth below as of December 31, 2010 and 2009 and for the years ended
December 31, 2010, 2009 and 2008 has been derived from and should be read in conjunction with the audited
consolidated financial statements and other financial information presented elsewhere herein. The selected financial
information set forth below as of December 31, 2008, 2007 and 2006 and for the years ended December 31, 2007 and 2006
has been derived from audited consolidated financial statements not included herein. Capitalized terms are as defined and
described in the consolidated financial statements or elsewhere herein.
2010 2009 2008 2007 2006
Year Ended December 31,
(in millions, except per share data)
Selected Operating Statement Information:
(a)
Revenues:
Video . . . ............................. $ 10,995 $ 10,760 $ 10,524 $ 10,165 $ 7,632
High-speed data. . ....................... 4,960 4,520 4,159 3,730 2,756
Voice . . . ............................. 2,032 1,886 1,619 1,193 715
Advertising ............................ 881 702 898 867 664
Total revenues............................ 18,868 17,868 17,200 15,955 11,767
Total costs and expenses
(b)
................... 15,179 14,551 28,982 13,189 9,588
Operating Income (Loss)
(b)
.................. 3,689 3,317 (11,782) 2,766 2,179
Interest expense, net ....................... (1,394) (1,319) (923) (894) (646)
Other income (expense), net
(c)
................ (99) (86) (367) 156 131
Income (loss) from continuing operations before
income taxes ........................... 2,196 1,912 (13,072) 2,028 1,664
Income tax benefit (provision) ................ (883) (820) 5,109 (806) (645)
Income (loss) from continuing operations . ....... 1,313 1,092 (7,963) 1,222 1,019
Discontinued operations, net of tax . ............ — — — — 1,042
Cumulative effect of accounting change, net of
tax
(d)
................................ — — — — 2
Net income (loss) . . ....................... 1,313 1,092 (7,963) 1,222 2,063
Less: Net (income) loss attributable to
noncontrolling interests . .................. (5) (22) 619 (99) (87)
Net income (loss) attributable to TWC
shareholders ........................... $ 1,308 $ 1,070 $ (7,344) $ 1,123 $ 1,976
Basic income (loss) from continuing operations per
common share attributable to TWC common
shareholders ........................... $ 3.67 $ 3.07 $ (22.55) $ 3.45 $ 2.84
Discontinued operations . . . .................. — — — — 3.14
Cumulative effect of accounting change . . ....... — — — — 0.01
Basic net income (loss) per common share
attributable to
TWC common shareholders ................ $ 3.67 $ 3.07 $ (22.55) $ 3.45 $ 5.99
Diluted income (loss) from continuing operations
per common share attributable to TWC common
shareholders ........................... $ 3.64 $ 3.05 $ (22.55) $ 3.45 $ 2.84
Discontinued operations . . . .................. — — — — 3.14
Cumulative effect of accounting change . . ....... — — — — 0.01
Diluted net income (loss) per common share
attributable to
TWC common shareholders ................ $ 3.64 $ 3.05 $ (22.55) $ 3.45 $ 5.99
Average common shares outstanding:
Basic .................................. 354.2 349.0 325.7 325.6 330.1
Diluted ................................. 359.5 350.9 325.7 325.7 330.1
Cash dividends declared per share . ............ $ 1.60 $ — $ — $ — $ —
Special cash dividend declared and paid per share . . $ — $ 30.81 $ — $ — $ —
126