Time Warner Cable 2010 Annual Report Download - page 66
Download and view the complete annual report
Please find page 66 of the 2010 Time Warner Cable annual report below. You can navigate through the pages in the report by either clicking on the pages listed below, or by using the keyword search tool below to find specific information within the annual report.-
 1
1 -
2
-
3
-
4
-
5
-
6
-
7
-
8
-
9
-
10
-
11
-
12
-
13
-
14
-
15
-
16
-
17
-
18
-
19
-
20
-
21
-
22
-
23
-
24
-
25
-
26
-
27
-
28
-
29
-
30
-
31
-
32
-
33
-
34
-
35
-
36
-
37
-
38
-
39
-
40
-
41
-
42
-
43
-
44
-
45
-
46
-
47
-
48
-
49
-
50
-
51
-
52
-
53
-
54
-
55
-
 56
56 -
 57
57 -
 58
58 -
 59
59 -
 60
60 -
 61
61 -
 62
62 -
 63
63 -
 64
64 -
 65
65 -
 66
66 -
 67
67 -
 68
68 -
 69
69 -
 70
70 -
 71
71 -
 72
72 -
 73
73 -
 74
74 -
 75
75 -
 76
76 -
77
-
78
-
79
-
80
-
81
-
82
-
83
-
84
-
85
-
86
-
87
-
88
-
89
-
90
-
91
-
92
-
93
-
94
-
95
-
96
-
97
-
98
-
99
-
100
-
101
-
102
-
103
-
104
-
105
-
106
-
107
-
108
-
109
-
110
-
111
-
112
-
113
-
114
-
115
-
116
-
117
-
118
-
119
-
120
-
121
-
122
-
123
-
124
-
125
-
126
-
127
-
128
-
129
-
130
-
131
-
132
-
133
-
134
-
135
-
136
-
137
-
138
-
139
-
140
-
141
-
142
-
143
-
144
-
145
-
146
-
147
-
148
-
149
-
150
-
151
-
152
 |
 |

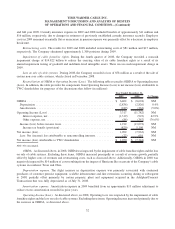
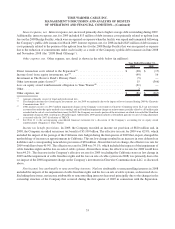
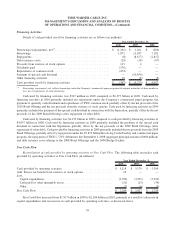
Net income (loss) attributable to TWC shareholders and net income (loss) per common share attributable to TWC
common shareholders. Net income (loss) attributable to TWC shareholders and net income (loss) per common share
attributable to TWC common shareholders were as follows for 2009 and 2008 (in millions, except per share data):
2009 2008 % Change
Year Ended December 31,
Net income (loss) attributable to TWC shareholders ............... $ 1,070 $ (7,344) NM
Net income (loss) per common share attributable to TWC common
shareholders:
Basic . ............................................... $ 3.07 $ (22.55) NM
Diluted .............................................. $ 3.05 $ (22.55) NM
NM—Not meaningful.
As discussed above, in 2008, net loss attributable to TWC shareholders and net loss per common share attributable to
TWC common shareholders were impacted by the impairment of cable franchise rights and the loss on sale of cable
systems. Excluding these items, net income attributable to TWC shareholders and net income per common share
attributable to TWC common shareholders increased primarily due to an increase in Operating Income and decreases in
other expense, net, and net income attributable to noncontrolling interests, partially offset by increases in interest expense,
net, and income tax provision, each as discussed above.
FINANCIAL CONDITION AND LIQUIDITY
Management believes that cash generated by or available to TWC should be sufficient to fund its capital and liquidity
needs for the foreseeable future, including quarterly dividend payments and common stock repurchases. TWC’s sources
of cash include cash provided by operating activities, cash and equivalents on hand, borrowing capacity under its
committed credit facility and commercial paper program, as well as access to capital markets.
The Company generally invests its cash and equivalents in a combination of money market, government and treasury
funds, as well as other similar instruments, in accordance with the Company’s investment policy of diversifying its
investments and limiting the amount of its investments in a single entity or fund. As of December 31, 2010, nearly all of
the Company’s cash and equivalents was invested in money market funds and certificates of deposit (“CD”), with no more
than 15% invested in any one fund or CD.
TWC’s unused committed financial capacity was $6.891 billion as of December 31, 2010, reflecting $3.047 billion
of cash and equivalents and $3.844 billion of available borrowing capacity under the Company’s $4.0 billion Revolving
Credit Facility.
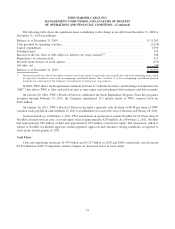
Current Financial Condition
As of December 31, 2010, the Company had $23.121 billion of debt, $3.047 billion of cash and equivalents (net debt
of $20.074 billion, defined as total debt less cash and equivalents), $300 million of mandatorily redeemable non-voting
Series A Preferred Equity Membership Units (the “TW NY Cable Preferred Membership Units”) issued by a subsidiary of
TWC, Time Warner NY Cable LLC (“TW NY Cable”), and $9.210 billion of total TWC shareholders’ equity. As of
December 31, 2009, the Company had $22.331 billion of debt, $1.048 billion of cash and equivalents (net debt of
$21.283 billion), $300 million of TW NY Cable Preferred Membership Units and $8.685 billion of total TWC
shareholders’ equity.
54
TIME WARNER CABLE INC.
MANAGEMENT’S DISCUSSION AND ANALYSIS OF RESULTS
OF OPERATIONS AND FINANCIAL CONDITION—(Continued)