Time Warner Cable 2010 Annual Report Download - page 58
Download and view the complete annual report
Please find page 58 of the 2010 Time Warner Cable annual report below. You can navigate through the pages in the report by either clicking on the pages listed below, or by using the keyword search tool below to find specific information within the annual report.-
 1
1 -
2
-
3
-
4
-
5
-
6
-
7
-
8
-
9
-
10
-
11
-
12
-
13
-
14
-
15
-
16
-
17
-
18
-
19
-
20
-
21
-
22
-
23
-
24
-
25
-
26
-
27
-
28
-
29
-
30
-
31
-
32
-
33
-
34
-
35
-
36
-
37
-
38
-
39
-
40
-
41
-
42
-
43
-
44
-
45
-
46
-
47
-
 48
48 -
 49
49 -
 50
50 -
 51
51 -
 52
52 -
 53
53 -
 54
54 -
 55
55 -
 56
56 -
 57
57 -
 58
58 -
 59
59 -
 60
60 -
 61
61 -
 62
62 -
 63
63 -
 64
64 -
 65
65 -
 66
66 -
 67
67 -
 68
68 -
69
-
70
-
71
-
72
-
73
-
74
-
75
-
76
-
77
-
78
-
79
-
80
-
81
-
82
-
83
-
84
-
85
-
86
-
87
-
88
-
89
-
90
-
91
-
92
-
93
-
94
-
95
-
96
-
97
-
98
-
99
-
100
-
101
-
102
-
103
-
104
-
105
-
106
-
107
-
108
-
109
-
110
-
111
-
112
-
113
-
114
-
115
-
116
-
117
-
118
-
119
-
120
-
121
-
122
-
123
-
124
-
125
-
126
-
127
-
128
-
129
-
130
-
131
-
132
-
133
-
134
-
135
-
136
-
137
-
138
-
139
-
140
-
141
-
142
-
143
-
144
-
145
-
146
-
147
-
148
-
149
-
150
-
151
-
152
 |
 |

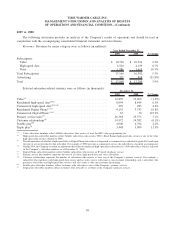
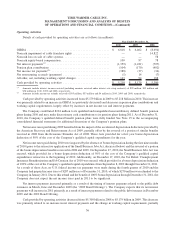
Selling, general and administrative expenses. The components of selling, general and administrative expenses were
as follows (in millions):
2010 2009 % Change
Year Ended December 31,
Employee .................................................... $ 1,262 $ 1,153 9.5%
Marketing .................................................... 629 563 11.7%
Bad debt
(a)
................................................... 114 143 (20.3%)
Separation-related “make-up” equity award costs
(b)
...................... 5 9 (44.4%)
Other ....................................................... 1,047 962 8.8%
Total ........................................................ $ 3,057 $ 2,830 8.0%
(a)
Bad debt expense includes amounts charged to expense associated with the Company’s allowance for doubtful accounts and collection expenses,
net of late fees billed to subscribers. Late fees billed to subscribers were $140 million and $118 million in 2010 and 2009, respectively.
(b)
As a result of the Separation, pursuant to their terms, Time Warner equity awards held by TWC employees were forfeited and/or experienced a
reduction in value as of the date of the Separation. Amounts represent the costs associated with TWC stock options and restricted stock units
granted to TWC employees during the second quarter of 2009 to offset these forfeitures and/or reduced values (“Separation-related ‘make-up’
equity award costs”).
Selling, general and administrative expenses increased primarily as a result of increases in employee costs (primarily
due to higher headcount and compensation, as well as $12 million of executive severance costs in the fourth quarter of
2010), marketing expense and consulting and professional fees, partially offset by a decrease in bad debt expense
primarily due to improvements in collection efforts during 2010. Bad debt expense for the fourth quarter of 2010
increased compared to 2009 as the fourth quarter of 2009 included a benefit from the reduction in the allowance for
doubtful accounts to reflect the quality of residential receivables as of the end of 2009, which benefited both the fourth
quarter and full year 2009. Additionally, casualty insurance expense in 2009 included a benefit of approximately
$11 million due to changes in estimates of previously established casualty insurance accruals.
Restructuring costs. The results for 2010 and 2009 include restructuring costs of $52 million and $81 million,
respectively, primarily related to headcount reductions of approximately 900 and 1,300 in 2010 and 2009, respectively,
and other exit costs, including the termination of a facility lease that occurred during the second quarter of 2010. The
Company expects to incur additional restructuring costs during 2011.
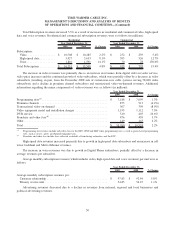
Reconciliation of OIBDA to Operating Income. The following table reconciles OIBDA to Operating Income. In
addition, the table provides the components from Operating Income to net income attributable to TWC shareholders for
purposes of the discussions that follow (in millions):
2010 2009 % Change
Year Ended December 31,
OIBDA ...................................................... $ 6,818 $ 6,402 6.5%
Depreciation ................................................ (2,961) (2,836) 4.4%
Amortization ................................................ (168) (249) (32.5%)
Operating Income .............................................. 3,689 3,317 11.2%
Interest expense, net ......................................... (1,394) (1,319) 5.7%
Other expense, net .......................................... (99) (86) 15.1%
Income before income taxes ..................................... 2,196 1,912 14.9%
Income tax provision ........................................ (883) (820) 7.7%
Net income ................................................... 1,313 1,092 20.2%
Less: Net income attributable to noncontrolling interests . ............... (5) (22) (77.3%)
Net income attributable to TWC shareholders .......................... $ 1,308 $ 1,070 22.2%
46
TIME WARNER CABLE INC.
MANAGEMENT’S DISCUSSION AND ANALYSIS OF RESULTS
OF OPERATIONS AND FINANCIAL CONDITION—(Continued)