OfficeMax 2012 Annual Report Download - page 99
Download and view the complete annual report
Please find page 99 of the 2012 OfficeMax annual report below. You can navigate through the pages in the report by either clicking on the pages listed below, or by using the keyword search tool below to find specific information within the annual report.-
 1
1 -
2
-
3
-
4
-
5
-
6
-
7
-
8
-
9
-
10
-
11
-
12
-
13
-
14
-
15
-
16
-
17
-
18
-
19
-
20
-
21
-
22
-
23
-
24
-
25
-
26
-
27
-
28
-
29
-
30
-
31
-
32
-
33
-
34
-
35
-
36
-
37
-
38
-
39
-
40
-
41
-
42
-
43
-
44
-
45
-
46
-
47
-
48
-
49
-
50
-
51
-
52
-
53
-
54
-
55
-
56
-
57
-
58
-
59
-
60
-
61
-
62
-
63
-
64
-
65
-
66
-
67
-
68
-
69
-
70
-
71
-
72
-
73
-
74
-
75
-
76
-
77
-
78
-
79
-
80
-
81
-
82
-
83
-
84
-
85
-
86
-
87
-
88
-
 89
89 -
 90
90 -
 91
91 -
 92
92 -
 93
93 -
 94
94 -
 95
95 -
 96
96 -
 97
97 -
 98
98 -
 99
99 -
 100
100 -
 101
101 -
 102
102 -
 103
103 -
 104
104 -
 105
105 -
 106
106 -
 107
107 -
 108
108 -
 109
109 -
110
-
111
-
112
-
113
-
114
-
115
-
116
-
117
-
118
-
119
-
120
-
121
-
122
-
123
-
124
-
125
-
126
-
127
-
128
-
129
-
130
-
131
-
132
-
133
-
134
-
135
-
136
-
137
-
138
-
139
-
140
-
141
-
142
-
143
-
144
-
145
-
146
-
147
-
148
 |
 |

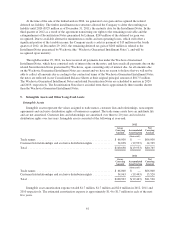
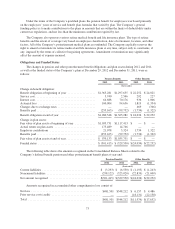
6. Net Income Per Common Share
Basic net income per common share is calculated using net income available to holders of our common
stock divided by the weighted average number of shares of common stock outstanding during the applicable
periods presented. Diluted net income per common share is similar to basic net income per common share except
that the weighted average number of shares of common stock outstanding is increased to include, if their
inclusion is dilutive, the number of additional shares of common stock that would have been outstanding
assuming the issuance of all potentially dilutive shares, such as common stock to be issued upon exercise of
options, the vesting of non-vested restricted shares, and the conversion of outstanding preferred stock. Net
income per common share was determined by dividing net income, as adjusted, by weighted average shares
outstanding as follows:
Basic Net Income per Common Share
2012 2011 2010
(thousands, except per-share amounts)
Net income available to OfficeMax common shareholders .................. $414,694 $32,771 $68,628
Average shares—basic .............................................. 86,594 85,881 84,908
Net income available to OfficeMax common shareholders per common share:
Basic ........................................................ $ 4.79 $ 0.38 $ 0.81
Diluted Net Income per Common Share
2012 2011 2010
(thousands, except per-share amounts)
Net income available to OfficeMax common shareholders .................. $414,694 $32,771 $68,628
Preferred dividends (a) .............................................. 2,096 — —
Diluted net income attributable to OfficeMax ............................ 416,790 32,771 68,628
Average shares—basic .............................................. 86,594 85,881 84,908
Restricted stock, stock options, preferred share conversion and other(a)(b) ..... 1,345 1,116 1,604
Average shares—diluted ............................................ 87,939 86,997 86,512
Diluted net income attributable to OfficeMax per common share:
Diluted ...................................................... $ 4.74 $ 0.38 $ 0.79
(a) The assumed conversion of outstanding preferred stock was anti-dilutive in 2010 and 2011, and therefore no
adjustment was required to determine diluted income from continuing operations or average shares-diluted.
(b) Options to purchase 3.8 million, 3.7 million and 1.7 million shares of common stock were outstanding
during 2012, 2011 and 2010, respectively, but were not included in the computation of diluted income per
common share because the impact would have been anti-dilutive as the option price was higher than the
average market price during the year.
63