OfficeMax 2012 Annual Report Download - page 58
Download and view the complete annual report
Please find page 58 of the 2012 OfficeMax annual report below. You can navigate through the pages in the report by either clicking on the pages listed below, or by using the keyword search tool below to find specific information within the annual report.-
 1
1 -
2
-
3
-
4
-
5
-
6
-
7
-
8
-
9
-
10
-
11
-
12
-
13
-
14
-
15
-
16
-
17
-
18
-
19
-
20
-
21
-
22
-
23
-
24
-
25
-
26
-
27
-
28
-
29
-
30
-
31
-
32
-
33
-
34
-
35
-
36
-
37
-
38
-
39
-
40
-
41
-
42
-
43
-
44
-
45
-
46
-
47
-
 48
48 -
 49
49 -
 50
50 -
 51
51 -
 52
52 -
 53
53 -
 54
54 -
 55
55 -
 56
56 -
 57
57 -
 58
58 -
 59
59 -
 60
60 -
 61
61 -
 62
62 -
 63
63 -
 64
64 -
 65
65 -
 66
66 -
 67
67 -
 68
68 -
69
-
70
-
71
-
72
-
73
-
74
-
75
-
76
-
77
-
78
-
79
-
80
-
81
-
82
-
83
-
84
-
85
-
86
-
87
-
88
-
89
-
90
-
91
-
92
-
93
-
94
-
95
-
96
-
97
-
98
-
99
-
100
-
101
-
102
-
103
-
104
-
105
-
106
-
107
-
108
-
109
-
110
-
111
-
112
-
113
-
114
-
115
-
116
-
117
-
118
-
119
-
120
-
121
-
122
-
123
-
124
-
125
-
126
-
127
-
128
-
129
-
130
-
131
-
132
-
133
-
134
-
135
-
136
-
137
-
138
-
139
-
140
-
141
-
142
-
143
-
144
-
145
-
146
-
147
-
148
 |
 |

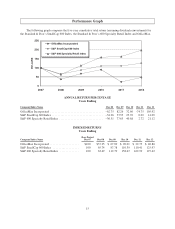
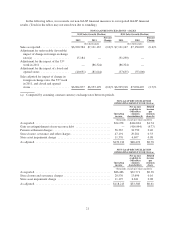
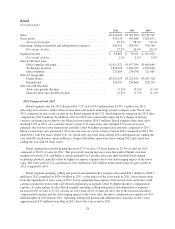
NON-GAAP RECONCILIATION
OPERATING RESULTS FOR 2010(a)
Operating
income
Net income
available to
OfficeMax
common
shareholders
Diluted
income
per
common
share
(thousands, except per-share amounts)
As reported ..................................................... $146,466 $68,628 $0.79
Store closure charges and severance adjustments ....................... 12,540 7,717 0.09
Store asset impairment charge ...................................... 10,979 6,708 0.08
Reserve adjustments related to legacy facility .......................... (9,463) (5,782) (0.07)
As adjusted ..................................................... $160,522 $77,271 $0.89
(a) Totals may not foot due to rounding.
(b) The conversion of preferred shares into common shares had a dilutive impact on earnings per share for 2012
due to the unusually large net income available to OfficeMax common shareholders, as a result of an agreement
that legally extinguished our non-recourse debt guaranteed by Lehman. Therefore, preferred dividends are
excluded from the income used to calculate diluted income per common share.
These items are described in more detail in this Management’s Discussion and Analysis.
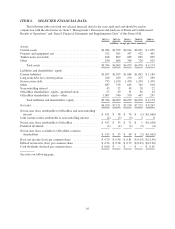
At the end of the 2012 fiscal year, we had $495.1 million in cash and cash equivalents and $580.2 million in
available (unused) borrowing capacity under our revolving credit facility. At year-end, we had outstanding
recourse debt of $236.2 million (both current and long-term) and non-recourse obligations of $735.0 million
related to the timber securitization notes. There is no recourse against OfficeMax on the securitized timber notes
payable as recourse is limited to proceeds from the applicable pledged installment notes receivable and
underlying guarantees. The non-recourse debt declined significantly in 2012 due to an agreement that legally
extinguished our non-recourse debt guaranteed by Lehman. There were no borrowings on our credit agreements
in 2012.
The funded status of our pension plans improved in 2012. Our pension obligations exceeded the assets held
in trust to fund them by $301.4 million at year-end 2012, an improvement in funded status of $28.2 million,
compared to the $329.6 million underfunding that existed at year-end 2011. This improvement in funded status
was primarily due to higher than anticipated returns on investments and the impact of special-election lump sum
benefit payments, which were partially offset by an unfavorable change in the discount rate.
For full year 2012, operations provided $185.2 million of cash, while capital expenditures, net of proceeds
(including systems and infrastructure investments) and financing activities used $85.2 million and $34.8 million,
respectively.
Outlook
Based on the current environment and our 2012 trends, we expect that total sales for the full year of 2013
will be in line with 2012, including the favorable impact of foreign currency translation. Additionally, we expect
that the operating income margin rate for the full year of 2013 will be in line with the prior year adjusted rate,
despite the negative impact of increased rent expense resulting from the completed non-cash amortization of
liabilities related to the 2003 merger, as well of the discontinuation of dividend income due to the redemption of
our non-voting securities of Boise Cascade L.L.C.
We anticipate cash flow from operations in 2013 to be higher than capital expenditures, which we expect to
be approximately $100 million to $125 million, primarily related to investments in IT, ecommerce, infrastructure
and maintenance. We anticipate a net reduction in our retail square footage for the year, with five to ten store
closures and several new-format store openings in the U.S., and six expected store openings in Mexico.
22