OfficeMax 2012 Annual Report Download - page 85
Download and view the complete annual report
Please find page 85 of the 2012 OfficeMax annual report below. You can navigate through the pages in the report by either clicking on the pages listed below, or by using the keyword search tool below to find specific information within the annual report.-
 1
1 -
2
-
3
-
4
-
5
-
6
-
7
-
8
-
9
-
10
-
11
-
12
-
13
-
14
-
15
-
16
-
17
-
18
-
19
-
20
-
21
-
22
-
23
-
24
-
25
-
26
-
27
-
28
-
29
-
30
-
31
-
32
-
33
-
34
-
35
-
36
-
37
-
38
-
39
-
40
-
41
-
42
-
43
-
44
-
45
-
46
-
47
-
48
-
49
-
50
-
51
-
52
-
53
-
54
-
55
-
56
-
57
-
58
-
59
-
60
-
61
-
62
-
63
-
64
-
65
-
66
-
67
-
68
-
69
-
70
-
71
-
72
-
73
-
74
-
 75
75 -
 76
76 -
 77
77 -
 78
78 -
 79
79 -
 80
80 -
 81
81 -
 82
82 -
 83
83 -
 84
84 -
 85
85 -
 86
86 -
 87
87 -
 88
88 -
 89
89 -
 90
90 -
 91
91 -
 92
92 -
 93
93 -
 94
94 -
 95
95 -
96
-
97
-
98
-
99
-
100
-
101
-
102
-
103
-
104
-
105
-
106
-
107
-
108
-
109
-
110
-
111
-
112
-
113
-
114
-
115
-
116
-
117
-
118
-
119
-
120
-
121
-
122
-
123
-
124
-
125
-
126
-
127
-
128
-
129
-
130
-
131
-
132
-
133
-
134
-
135
-
136
-
137
-
138
-
139
-
140
-
141
-
142
-
143
-
144
-
145
-
146
-
147
-
148
 |
 |

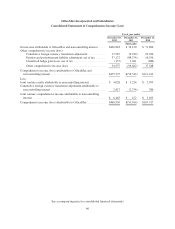
OfficeMax Incorporated and Subsidiaries
Consolidated Statements of Cash Flows
Fiscal year ended
December 29,
2012
December 31,
2011
December 25,
2010
(thousands)
Cash provided by operations:
Net income attributable to OfficeMax and noncontrolling interest .... $420,818 $ 38,120 $ 73,864
Non-cash items in net income:
Dividend income from investment in Boise Cascade Holdings,
L.L.C. ............................................. (8,455) (7,846) (7,254)
Depreciation and amortization ............................ 74,124 84,218 100,936
Non-cash gain on extinguishment of non-recourse debt ......... (670,766) — —
Non-cash impairment charges ............................. 11,376 11,197 10,979
Pension and other postretirement benefits expense ............ 57,076 8,328 4,965
Deferred income tax expense ............................. 227,111 7,419 26,123
Other ................................................ 56,312 19,296 2,530
Changes in operating assets and liabilities:
Receivables ........................................... 37,368 (14,674) 6,678
Inventories ............................................ 20,508 17,269 (27,606)
Accounts payable and accrued liabilities .................... 59,956 (54,873) (51,515)
Current and deferred income taxes ......................... (13,756) (1,425) 20,775
Payments of loans on company-owned life insurance policies .... — — (44,442)
Other ................................................ (86,471) (53,350) (27,896)
Cash provided by operations .............................. 185,201 53,679 88,137
Cash used for investment:
Expenditures for property and equipment ........................ (87,178) (69,632) (93,511)
Proceeds from sales of assets, net .............................. 1,934 259 6,173
Cash used for investment ................................ (85,244) (69,373) (87,338)
Cash used for financing:
Cash dividends paid:
Common stock ......................................... (3,470) — —
Preferred stock ......................................... (2,096) (3,286) (2,698)
(5,566) (3,286) (2,698)
Borrowings (payments) of short-term debt, net ................... 5,969 20 (654)
Payments of long-term debt .................................. (38,517) (6,136) (21,858)
Purchase of preferred stock ................................... (1,046) (2,125) (5,233)
Proceeds from exercise of stock options ......................... 1,029 1,949 1,961
Payments related to other share-based compensation ............... (1,370) (4,854) —
Other .................................................... 4,665 (3,520) 13
Cash used for financing .................................. (34,836) (17,952) (28,469)
Effect of exchange rates on cash and cash equivalents .............. 2,824 (1,569) 3,426
Increase (decrease) in cash and cash equivalents .................. 67,945 (35,215) (24,244)
Balance at beginning of the year ............................... 427,111 462,326 486,570
Balance at end of the year .................................... $495,056 $427,111 $462,326
See accompanying notes to consolidated financial statements
49