OfficeMax 2012 Annual Report Download - page 56
Download and view the complete annual report
Please find page 56 of the 2012 OfficeMax annual report below. You can navigate through the pages in the report by either clicking on the pages listed below, or by using the keyword search tool below to find specific information within the annual report.-
 1
1 -
2
-
3
-
4
-
5
-
6
-
7
-
8
-
9
-
10
-
11
-
12
-
13
-
14
-
15
-
16
-
17
-
18
-
19
-
20
-
21
-
22
-
23
-
24
-
25
-
26
-
27
-
28
-
29
-
30
-
31
-
32
-
33
-
34
-
35
-
36
-
37
-
38
-
39
-
40
-
41
-
42
-
43
-
44
-
45
-
 46
46 -
 47
47 -
 48
48 -
 49
49 -
 50
50 -
 51
51 -
 52
52 -
 53
53 -
 54
54 -
 55
55 -
 56
56 -
 57
57 -
 58
58 -
 59
59 -
 60
60 -
 61
61 -
 62
62 -
 63
63 -
 64
64 -
 65
65 -
 66
66 -
67
-
68
-
69
-
70
-
71
-
72
-
73
-
74
-
75
-
76
-
77
-
78
-
79
-
80
-
81
-
82
-
83
-
84
-
85
-
86
-
87
-
88
-
89
-
90
-
91
-
92
-
93
-
94
-
95
-
96
-
97
-
98
-
99
-
100
-
101
-
102
-
103
-
104
-
105
-
106
-
107
-
108
-
109
-
110
-
111
-
112
-
113
-
114
-
115
-
116
-
117
-
118
-
119
-
120
-
121
-
122
-
123
-
124
-
125
-
126
-
127
-
128
-
129
-
130
-
131
-
132
-
133
-
134
-
135
-
136
-
137
-
138
-
139
-
140
-
141
-
142
-
143
-
144
-
145
-
146
-
147
-
148
 |
 |

The Merger Agreement contains certain termination rights for both parties, and further provides for the
payment of fees and expenses upon termination under specified circumstances. The proposed merger is expected
to be completed by December 31, 2013.
For additional information relating to the proposed merger, please see our Form 8-K filed on February 22,
2013.
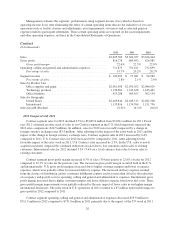
Results of Operations, Consolidated
($ in thousands)
2012 2011 2010
Sales ..................................................... $6,920,384 $7,121,167 $7,150,007
Gross profit ................................................ 1,784,457 1,809,180 1,849,652
Operating, selling and general and administrative expenses .......... 1,645,245 1,690,967 1,689,130
Asset impairments ........................................... 11,376 11,197 10,979
Other operating expenses, net .................................. 103,558 20,530 3,077
Total operating expenses ...................................... 1,760,179 1,722,694 1,703,186
Operating income ........................................... $ 24,278 $ 86,486 $ 146,466
Net income available to OfficeMax common shareholders ........... $ 414,694 $ 32,771 $ 68,628
Gross profit margin .......................................... 25.8% 25.4% 25.9%
Operating, selling and general and administrative expenses
Percentage of sales ...................................... 23.8% 23.7% 23.7%
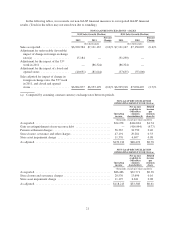
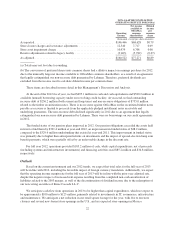
In addition to assessing our operating performance as reported under U.S. generally accepted accounting
principles (“GAAP”), we evaluate our results of operations before non-operating legacy items, such as the gain
related to an agreement that legally extinguished our non-recourse debt guaranteed by Lehman, and certain
operating items that are not indicative of our core operating activities such as accelerated pension expense related
to participant settlements, facility closures and adjustments, asset impairments and severance. We believe our
presentation of financial measures before, or excluding, these items, which are non-GAAP measures, enhances
our investors’ overall understanding of our operational performance and provides useful information to both
investors and management to evaluate the ongoing operations and prospects of OfficeMax by providing better
comparisons. Whenever we use non-GAAP financial measures, we designate these measures as “adjusted” and
provide a reconciliation of the non-GAAP financial measures to the most closely applicable GAAP financial
measure. Investors are encouraged to review the related GAAP financial measures and the reconciliation of these
non-GAAP financial measures to their most directly comparable GAAP financial measure. In the following
tables, we reconcile our non-GAAP financial measures to our reported GAAP financial results.
Although we believe the non-GAAP financial measures enhance an investor’s understanding of our
performance, our management does not itself, nor does it suggest that investors should, consider such non-GAAP
financial measures in isolation from, or as a substitute for, financial information prepared in accordance with
GAAP. The non-GAAP financial measures we use may not be consistent with the presentation of similar
companies in our industry. However, we present such non-GAAP financial measures in reporting our financial
results to provide investors with an additional tool to evaluate our operating results in a manner that focuses on
what we believe to be our ongoing business operations.
20