OfficeMax 2012 Annual Report Download - page 57
Download and view the complete annual report
Please find page 57 of the 2012 OfficeMax annual report below. You can navigate through the pages in the report by either clicking on the pages listed below, or by using the keyword search tool below to find specific information within the annual report.-
 1
1 -
2
-
3
-
4
-
5
-
6
-
7
-
8
-
9
-
10
-
11
-
12
-
13
-
14
-
15
-
16
-
17
-
18
-
19
-
20
-
21
-
22
-
23
-
24
-
25
-
26
-
27
-
28
-
29
-
30
-
31
-
32
-
33
-
34
-
35
-
36
-
37
-
38
-
39
-
40
-
41
-
42
-
43
-
44
-
45
-
46
-
 47
47 -
 48
48 -
 49
49 -
 50
50 -
 51
51 -
 52
52 -
 53
53 -
 54
54 -
 55
55 -
 56
56 -
 57
57 -
 58
58 -
 59
59 -
 60
60 -
 61
61 -
 62
62 -
 63
63 -
 64
64 -
 65
65 -
 66
66 -
 67
67 -
68
-
69
-
70
-
71
-
72
-
73
-
74
-
75
-
76
-
77
-
78
-
79
-
80
-
81
-
82
-
83
-
84
-
85
-
86
-
87
-
88
-
89
-
90
-
91
-
92
-
93
-
94
-
95
-
96
-
97
-
98
-
99
-
100
-
101
-
102
-
103
-
104
-
105
-
106
-
107
-
108
-
109
-
110
-
111
-
112
-
113
-
114
-
115
-
116
-
117
-
118
-
119
-
120
-
121
-
122
-
123
-
124
-
125
-
126
-
127
-
128
-
129
-
130
-
131
-
132
-
133
-
134
-
135
-
136
-
137
-
138
-
139
-
140
-
141
-
142
-
143
-
144
-
145
-
146
-
147
-
148
 |
 |

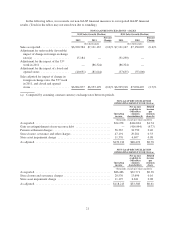
In the following tables, we reconcile our non-GAAP financial measures to our reported GAAP financial
results. (Totals in the tables may not sum down due to rounding.)
NON-GAAP RECONCILIATIONS – SALES
2012 Sales Growth (Decline) 2011 Sales Growth (Decline)
2012 2011
Percent
Change 2011 2010
Percent
Change
($ in thousands) ($ in thousands)
Sales as reported ................... $6,920,384 $7,121,167 (2.8)% $7,121,167 $7,150,007 (0.4)%
Adjustment for unfavorable (favorable)
impact of change in foreign exchange
rates(a) ........................ 15,184 — (91,290) —
Adjustment for the impact of the 53rd
week in 2011 ................... — (86,324) (86,324) —
Adjustment for the impact of closed and
opened stores ................... (40,691) (81,644) (37,635) (55,600)
Sales adjusted for impact of change in
foreign exchange rates, the 53rd week
in 2011, and closed and opened
stores .......................... $6,894,877 $6,953,199 (0.8)% $6,905,918 $7,094,407 (2.7)%
(a) Computed by assuming constant currency exchange rates between periods.
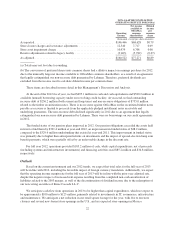
NON-GAAP RECONCILIATION
OPERATING RESULTS FOR 2012(a)
Operating
income
Net income
available to
OfficeMax
common
shareholders(b)
Diluted
income
per
common
share(b)
(thousands, except per-share amounts)
As reported ................................................... $24,278 $414,694 $4.74
Gain on extinguishment of non-recourse debt ........................ — (416,944) (4.77)
Pension settlement charges ....................................... 56,367 34,750 0.40
Store closure, severance and other charges ........................... 47,191 29,281 0.33
Store asset impairment charge .................................... 11,376 6,697 0.08
As adjusted ................................................... $139,212 $68,478 $0.78
NON-GAAP RECONCILIATION
OPERATING RESULTS FOR 2011(a)
Operating
income
Net income
available to
OfficeMax
common
shareholders
Diluted
income
per
common
share
(thousands, except per-share amounts)
As reported ................................................... $86,486 $32,771 $0.38
Store closure and severance charges ................................ 20,530 13,696 0.16
Store asset impairment charge .................................... 11,197 6,841 0.08
As adjusted ................................................... $118,213 $53,308 $0.61
21