OfficeMax 2012 Annual Report Download - page 67
Download and view the complete annual report
Please find page 67 of the 2012 OfficeMax annual report below. You can navigate through the pages in the report by either clicking on the pages listed below, or by using the keyword search tool below to find specific information within the annual report.-
 1
1 -
2
-
3
-
4
-
5
-
6
-
7
-
8
-
9
-
10
-
11
-
12
-
13
-
14
-
15
-
16
-
17
-
18
-
19
-
20
-
21
-
22
-
23
-
24
-
25
-
26
-
27
-
28
-
29
-
30
-
31
-
32
-
33
-
34
-
35
-
36
-
37
-
38
-
39
-
40
-
41
-
42
-
43
-
44
-
45
-
46
-
47
-
48
-
49
-
50
-
51
-
52
-
53
-
54
-
55
-
56
-
 57
57 -
 58
58 -
 59
59 -
 60
60 -
 61
61 -
 62
62 -
 63
63 -
 64
64 -
 65
65 -
 66
66 -
 67
67 -
 68
68 -
 69
69 -
 70
70 -
 71
71 -
 72
72 -
 73
73 -
 74
74 -
 75
75 -
 76
76 -
 77
77 -
78
-
79
-
80
-
81
-
82
-
83
-
84
-
85
-
86
-
87
-
88
-
89
-
90
-
91
-
92
-
93
-
94
-
95
-
96
-
97
-
98
-
99
-
100
-
101
-
102
-
103
-
104
-
105
-
106
-
107
-
108
-
109
-
110
-
111
-
112
-
113
-
114
-
115
-
116
-
117
-
118
-
119
-
120
-
121
-
122
-
123
-
124
-
125
-
126
-
127
-
128
-
129
-
130
-
131
-
132
-
133
-
134
-
135
-
136
-
137
-
138
-
139
-
140
-
141
-
142
-
143
-
144
-
145
-
146
-
147
-
148
 |
 |

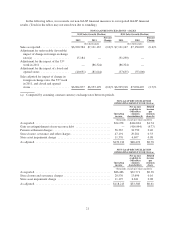
Two large transactions significantly affected the balance sheet during 2012. The first was our settlement
agreement that legally extinguished our non-recourse debt guaranteed by Lehman, which reduced non-recourse
debt and timber notes receivable, along with the use of available minimum tax credits and net operating losses to
offset the recognition of the related deferred tax gain, which reduced deferred taxes. The second was the non-
cash pension expense, which reduced accumulated other comprehensive loss and increased deferred tax assets.
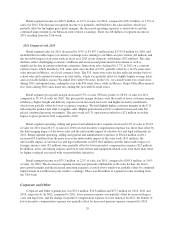
We sponsor noncontributory defined benefit pension plans covering certain terminated employees, vested
employees, retirees, and some active employees, primarily in Contract. Pension expense was $3.3 million,
$10.9 million and $7.3 million for the years ended December 29, 2012, December 31, 2011 and December 25,
2010, respectively. In 2012, 2011 and 2010, we made cash contributions to our pension plans totaling
$21.1 million, $3.3 million and $3.4 million, respectively. The estimated minimum required funding contribution
in 2013 is $3.3 million and the expense is projected to be $2.7 million compared to expense of $3.3 million in
2012. In addition, we may elect to make additional voluntary contributions. See “Critical Accounting Estimates”
in this Management’s Discussion and Analysis of Financial Condition and Results of Operations for more
information.
During 2012, our pension plans were amended to provide a one-time special election period during which
certain former employees, alternate payees, and beneficiaries could elect to have their pension benefits under the
Plan paid as an immediate lump sum payment or an immediately commencing annuity. Approximately 9,800
participants were eligible to elect an immediate lump sum payment or annuity. Of those participants eligible,
approximately 300 elected an annuity while approximately 5,600 elected an immediate lump sum payment. The
associated distributions by the pension plans from plan funds were approximately $150 million, and resulted in a
non-cash pre-tax charge by the Company of $56 million to expense the accumulated loss relating to these
participants that otherwise would have been amortized over their life expectancies. This action reduced the
pension benefit obligation liability by approximately $190 million.
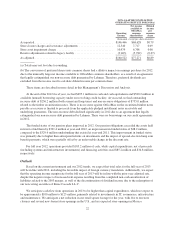
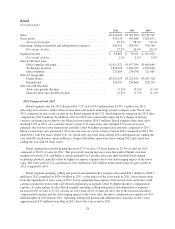
Investing Activities
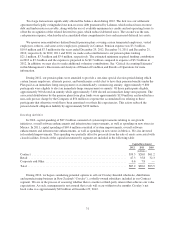
In 2012, capital spending of $87.2 million consisted of system improvements relating to our growth
initiatives, overall software enhancements and infrastructure improvements, as well as spending on new stores in
Mexico. In 2011, capital spending of $69.6 million consisted of system improvements, overall software
enhancements and infrastructure enhancements, as well as spending on new stores in Mexico. We also invested
in leasehold improvements. This spending was partially offset by proceeds from the sale of assets associated with
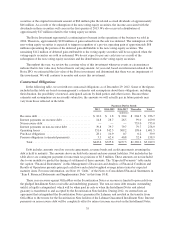
closed facilities. Details of the capital investment by segment are included in the following table:
Capital Investment
2012 2011 2010
(millions)
Contract ................................................................ $39.3 $26.0 $61.2
Retail .................................................................. 47.3 35.8 32.3
Corporate and Other ....................................................... 0.6 7.8 —
Total ................................................................... $87.2 $69.6 $93.5
During 2012, we began considering potential options to sell our Croxley-branded wholesale, distribution
and manufacturing business in New Zealand (“Croxley”), a wholly-owned subsidiary included in our Contract
segment. We are in the process of assessing whether there is market or third-party interest that achieves our value
expectations. As such, management is not assured that a sale will occur within twelve months. Croxley’s net
book value was approximately $49 million at December 29, 2012.
31