OfficeMax 2012 Annual Report Download - page 77
Download and view the complete annual report
Please find page 77 of the 2012 OfficeMax annual report below. You can navigate through the pages in the report by either clicking on the pages listed below, or by using the keyword search tool below to find specific information within the annual report.-
 1
1 -
2
-
3
-
4
-
5
-
6
-
7
-
8
-
9
-
10
-
11
-
12
-
13
-
14
-
15
-
16
-
17
-
18
-
19
-
20
-
21
-
22
-
23
-
24
-
25
-
26
-
27
-
28
-
29
-
30
-
31
-
32
-
33
-
34
-
35
-
36
-
37
-
38
-
39
-
40
-
41
-
42
-
43
-
44
-
45
-
46
-
47
-
48
-
49
-
50
-
51
-
52
-
53
-
54
-
55
-
56
-
57
-
58
-
59
-
60
-
61
-
62
-
63
-
64
-
65
-
66
-
 67
67 -
 68
68 -
 69
69 -
 70
70 -
 71
71 -
 72
72 -
 73
73 -
 74
74 -
 75
75 -
 76
76 -
 77
77 -
 78
78 -
 79
79 -
 80
80 -
 81
81 -
 82
82 -
 83
83 -
 84
84 -
 85
85 -
 86
86 -
 87
87 -
88
-
89
-
90
-
91
-
92
-
93
-
94
-
95
-
96
-
97
-
98
-
99
-
100
-
101
-
102
-
103
-
104
-
105
-
106
-
107
-
108
-
109
-
110
-
111
-
112
-
113
-
114
-
115
-
116
-
117
-
118
-
119
-
120
-
121
-
122
-
123
-
124
-
125
-
126
-
127
-
128
-
129
-
130
-
131
-
132
-
133
-
134
-
135
-
136
-
137
-
138
-
139
-
140
-
141
-
142
-
143
-
144
-
145
-
146
-
147
-
148
 |
 |
Merchandise Inventories
Inventories consist of office products merchandise and are stated at the lower of weighted average cost or
net realizable value. We estimate the realizable value of inventory using assumptions about future demand,
market conditions and product obsolescence. If the estimated realizable value is less than cost, the inventory
value is reduced to its estimated realizable value. If expectations regarding future demand and market conditions
are inaccurate or unexpected changes in technology or other factors affect demand, we could be exposed to
additional losses.
Throughout the year, we perform physical inventory counts at a significant number of our locations. For
periods subsequent to each location’s last physical inventory count, an allowance for estimated shrinkage is
provided based on historical shrinkage results and current business trends. If actual losses as a result of inventory
shrinkage are different than management’s estimates, adjustments to the allowance for inventory shrinkage may
be required.
Pensions and Other Postretirement Benefits
The Company sponsors noncontributory defined benefit pension plans covering certain terminated
employees, vested employees, retirees, and some active employees, primarily in Contract. The Company also
sponsors various retiree medical benefit plans. At December 29, 2012, the funded status of our defined benefit
pension and other postretirement benefit plans was a liability of $325.4 million. Changes in assumptions related
to the measurement of funded status could have a material impact on the amount reported. We are required to
calculate our pension expense and liabilities using actuarial assumptions, including a discount rate assumption
and a long-term asset return assumption. We base our discount rate assumption on the rates of return for a
theoretical portfolio of high-grade corporate bonds (rated AA- or better) with cash flows that generally match our
expected benefit payments in future years. We base our long-term asset return assumption on the average rate of
earnings expected on invested funds. We believe that the accounting estimate related to pensions is a critical
accounting estimate because it is highly susceptible to change from period to period, based on the performance of
plan assets, actuarial valuations and changes in interest rates, and the effect on our financial position and results
of operations could be material.
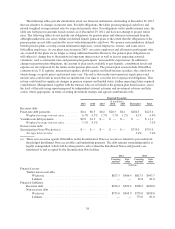
For 2013, our discount rate assumption used in the measurement of our net periodic benefit cost is 3.88%,
and our expected return on plan assets is 7.80%. Using these assumptions, our 2013 pension expense will be
approximately $2.7 million. If we were to decrease our estimated discount rate assumption used in the
measurement of our net periodic benefit cost to 3.63% and our expected return on plan assets to 7.55%, our 2013
pension expense would be approximately $4.6 million. If we were to increase our discount rate assumption used
in the measurement of our net periodic benefit cost to 4.13% and our expected return on plan assets to 8.05%, our
2013 pension expense would be approximately $0.7 million.
Income Taxes
Income taxes are accounted for under the asset and liability method. Deferred tax assets and liabilities are
recognized for the future tax consequences attributable to differences between the financial statement carrying
amounts of existing assets and liabilities and their respective tax basis and operating loss and tax credit
carryforwards. Deferred tax assets and liabilities are measured using enacted tax rates expected to apply to
taxable income in the years in which those temporary differences are expected to be recovered or settled. The
effect on deferred tax assets and liabilities of a change in tax rates is recognized in income in the period that
includes the enactment date.
The Company is subject to tax audits in numerous jurisdictions in the U.S. and around the world. Tax audits
by their very nature are often complex and can require several years to complete. In the normal course of
business, the Company is subject to challenges from the IRS and other tax authorities regarding amounts of taxes
41