OfficeMax 2012 Annual Report Download - page 114
Download and view the complete annual report
Please find page 114 of the 2012 OfficeMax annual report below. You can navigate through the pages in the report by either clicking on the pages listed below, or by using the keyword search tool below to find specific information within the annual report.-
 1
1 -
2
-
3
-
4
-
5
-
6
-
7
-
8
-
9
-
10
-
11
-
12
-
13
-
14
-
15
-
16
-
17
-
18
-
19
-
20
-
21
-
22
-
23
-
24
-
25
-
26
-
27
-
28
-
29
-
30
-
31
-
32
-
33
-
34
-
35
-
36
-
37
-
38
-
39
-
40
-
41
-
42
-
43
-
44
-
45
-
46
-
47
-
48
-
49
-
50
-
51
-
52
-
53
-
54
-
55
-
56
-
57
-
58
-
59
-
60
-
61
-
62
-
63
-
64
-
65
-
66
-
67
-
68
-
69
-
70
-
71
-
72
-
73
-
74
-
75
-
76
-
77
-
78
-
79
-
80
-
81
-
82
-
83
-
84
-
85
-
86
-
87
-
88
-
89
-
90
-
91
-
92
-
93
-
94
-
95
-
96
-
97
-
98
-
99
-
100
-
101
-
102
-
103
-
 104
104 -
 105
105 -
 106
106 -
 107
107 -
 108
108 -
 109
109 -
 110
110 -
 111
111 -
 112
112 -
 113
113 -
 114
114 -
 115
115 -
 116
116 -
 117
117 -
 118
118 -
 119
119 -
 120
120 -
 121
121 -
 122
122 -
 123
123 -
 124
124 -
125
-
126
-
127
-
128
-
129
-
130
-
131
-
132
-
133
-
134
-
135
-
136
-
137
-
138
-
139
-
140
-
141
-
142
-
143
-
144
-
145
-
146
-
147
-
148
 |
 |

Purchases and sales of securities are recorded on a trade-date basis. Interest income is recorded on the
accrual basis. Dividends are recorded on the ex-dividend date.
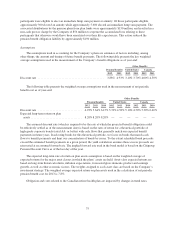
Cash Flows
Pension plan contributions include required statutory minimum amounts and, in some years, additional
discretionary amounts. During 2012, 2011 and 2010, the Company made cash contributions to its pension plans
totaling $21.1 million, $3.3 million and $3.4 million, respectively. Pension contributions for 2013 are estimated
to be $3.3 million. The Company may elect at any time to make additional voluntary contributions.
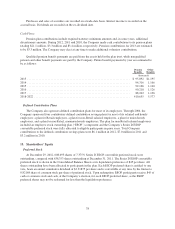
Qualified pension benefit payments are paid from the assets held in the plan trust, while nonqualified
pension and other benefit payments are paid by the Company. Future benefit payments by year are estimated to
be as follows:
Pension
Benefits
Other
Benefits
(thousands)
2013 ...................................................................... $ 95,892 $1,195
2014 ...................................................................... 94,316 1,166
2015 ...................................................................... 92,106 1,140
2016 ...................................................................... 90,218 1,126
2017 ...................................................................... 88,242 1,126
2018-2022 ................................................................. 410,655 5,577
Defined Contribution Plans
The Company also sponsors defined contribution plans for most of its employees. Through 2004, the
Company sponsored four contributory defined contribution savings plans for most of its salaried and hourly
employees: a plan for Retail employees, a plan for non-Retail salaried employees, a plan for union hourly
employees, and a plan for non-Retail, nonunion hourly employees. The plan for non-Retail salaried employees
included an employee stock ownership plan (“ESOP”) component and the Company’s Series D ESOP
convertible preferred stock were fully allocated to eligible participants in prior years. Total Company
contributions to the defined contribution savings plans were $6.1 million in 2012, $7.0 million in 2011 and
$3.2 million in 2010.
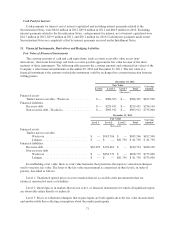
13. Shareholders’ Equity
Preferred Stock
At December 29, 2012, 608,693 shares of 7.375% Series D ESOP convertible preferred stock were
outstanding, compared with 638,353 shares outstanding at December 31, 2011. The Series D ESOP convertible
preferred stock is shown in the Consolidated Balance Sheets at its liquidation preference of $45 per share. All
shares outstanding have been allocated to participants in the plan. Each ESOP preferred share is entitled to one
vote, bears an annual cumulative dividend of $3.31875 per share and is convertible at any time by the trustee to
0.82168 share of common stock per share of preferred stock. Upon redemption, ESOP participants receive $45 of
cash or common stock and cash, at the Company’s election, for each ESOP preferred share, as the ESOP
preferred shares may not be redeemed for less than the liquidation preference.
78