OfficeMax 2012 Annual Report Download - page 66
Download and view the complete annual report
Please find page 66 of the 2012 OfficeMax annual report below. You can navigate through the pages in the report by either clicking on the pages listed below, or by using the keyword search tool below to find specific information within the annual report.-
 1
1 -
2
-
3
-
4
-
5
-
6
-
7
-
8
-
9
-
10
-
11
-
12
-
13
-
14
-
15
-
16
-
17
-
18
-
19
-
20
-
21
-
22
-
23
-
24
-
25
-
26
-
27
-
28
-
29
-
30
-
31
-
32
-
33
-
34
-
35
-
36
-
37
-
38
-
39
-
40
-
41
-
42
-
43
-
44
-
45
-
46
-
47
-
48
-
49
-
50
-
51
-
52
-
53
-
54
-
55
-
 56
56 -
 57
57 -
 58
58 -
 59
59 -
 60
60 -
 61
61 -
 62
62 -
 63
63 -
 64
64 -
 65
65 -
 66
66 -
 67
67 -
 68
68 -
 69
69 -
 70
70 -
 71
71 -
 72
72 -
 73
73 -
 74
74 -
 75
75 -
 76
76 -
77
-
78
-
79
-
80
-
81
-
82
-
83
-
84
-
85
-
86
-
87
-
88
-
89
-
90
-
91
-
92
-
93
-
94
-
95
-
96
-
97
-
98
-
99
-
100
-
101
-
102
-
103
-
104
-
105
-
106
-
107
-
108
-
109
-
110
-
111
-
112
-
113
-
114
-
115
-
116
-
117
-
118
-
119
-
120
-
121
-
122
-
123
-
124
-
125
-
126
-
127
-
128
-
129
-
130
-
131
-
132
-
133
-
134
-
135
-
136
-
137
-
138
-
139
-
140
-
141
-
142
-
143
-
144
-
145
-
146
-
147
-
148
 |
 |
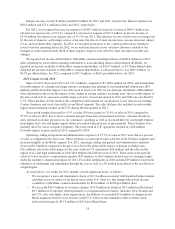
Liquidity and Capital Resources
At the end of fiscal year 2012, the total liquidity available for OfficeMax was $1,075.3 million. This
includes cash and cash equivalents of $495.1 million, including $128.1 million in foreign cash balances, and
borrowing availability of $580.2 million from our credit agreement associated with the Company and certain of
our subsidiaries in the U.S., Puerto Rico and Canada. During the first quarter of 2012, we exercised our option to
terminate our credit agreement associated with our subsidiaries in Australia and New Zealand effective
March 30, 2012. At the end of the fiscal year 2012, the Company was in compliance with all covenants under the
one remaining credit agreement. The credit agreement associated with the Company and certain of our
subsidiaries in the U.S., Puerto Rico and Canada expires on October 7, 2016. At the end of fiscal year 2012, we
had $236.2 million of short-term and long-term recourse debt and $735.0 million of non-recourse timber
securitization notes outstanding.
Under certain circumstances there are restrictions on our ability to repatriate certain amounts of foreign cash
balances. If the Company chose to repatriate certain unrestricted foreign cash balances, it could result in a
repatriation provision of approximately $2.5 million in excess of the amount already accrued and $4.8 million in
cash taxes due.
Our primary ongoing cash requirements relate to working capital, expenditures for property and equipment,
technology enhancements and upgrades, lease obligations, pension funding and debt service. We expect to fund
these requirements through a combination of available cash balance and cash flow from operations. We also have
the revolving credit facility as additional liquidity. The following sections of this Management’s Discussion and
Analysis of Financial Condition and Results of Operations discuss in more detail our operating, investing, and
financing activities, as well as our financing arrangements.
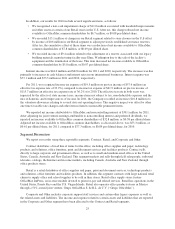
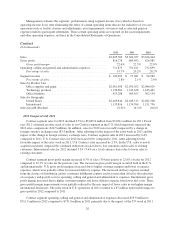
Operating Activities
Our operating activities provided cash of $185.2 million in 2012 compared to $53.7 million in 2011. Cash
from operations for 2012 was higher than the prior year primarily reflecting favorable working capital changes
and higher earnings. Our earnings included two non-cash items related to our gain on extinguishment of non-
recourse debt, the pre-tax gain of $670.8 million and the non-cash portion of the related tax expense of $253.8
million, as well as higher non-cash pension expense due to the acceleration of pension expense related to
participant distributions, all of which are reported as non-cash adjustments to income in our Consolidated
Statements of Cash Flows.
Inventory balances at the end of 2012 were lower than at the end of 2011, primarily due to closed stores in
the U.S. Accounts payable was higher at the end of 2012 then at the end of 2011, primarily in the U.S., despite
the decreased inventory balances, due to the deferral of certain payments into 2013 resulting from late
reconciliation issues at the end of 2012 that have subsequently been resolved. Collections from our domestic
receivables were higher during 2012 than during 2011, as there was increased vendor-supported promotional
activity at the end of 2011 that was subsequently collected in 2012.
Our operating activities generated cash of $88.1 million in 2010. Cash from operations in 2010 was net of
$44.4 million of payments of loans on company-owned life insurance policies (“COLI policies”) as well as $72.4
million of increased working capital primarily from larger holdings of our international inventories and the
timing of repayments and obligations.
Cash from operations in 2011 and 2010 included the impact of approximately $55 million and $58 million,
respectively, of incentive compensation payments made associated with the achievement of incentive plan
performance targets for 2010 and 2009, respectively. The Company accrued a minimal amount of incentive
compensation in 2011, as performance targets were generally not achieved. Therefore, 2012 incentive
compensation payments were minimal. Incentive compensation expense was higher in 2012 than in 2011, which
will result in incentive compensation payments in 2013, although not at the same levels as 2011 and 2010.
30