OfficeMax 2012 Annual Report Download - page 86
Download and view the complete annual report
Please find page 86 of the 2012 OfficeMax annual report below. You can navigate through the pages in the report by either clicking on the pages listed below, or by using the keyword search tool below to find specific information within the annual report.-
 1
1 -
2
-
3
-
4
-
5
-
6
-
7
-
8
-
9
-
10
-
11
-
12
-
13
-
14
-
15
-
16
-
17
-
18
-
19
-
20
-
21
-
22
-
23
-
24
-
25
-
26
-
27
-
28
-
29
-
30
-
31
-
32
-
33
-
34
-
35
-
36
-
37
-
38
-
39
-
40
-
41
-
42
-
43
-
44
-
45
-
46
-
47
-
48
-
49
-
50
-
51
-
52
-
53
-
54
-
55
-
56
-
57
-
58
-
59
-
60
-
61
-
62
-
63
-
64
-
65
-
66
-
67
-
68
-
69
-
70
-
71
-
72
-
73
-
74
-
75
-
 76
76 -
 77
77 -
 78
78 -
 79
79 -
 80
80 -
 81
81 -
 82
82 -
 83
83 -
 84
84 -
 85
85 -
 86
86 -
 87
87 -
 88
88 -
 89
89 -
 90
90 -
 91
91 -
 92
92 -
 93
93 -
 94
94 -
 95
95 -
 96
96 -
97
-
98
-
99
-
100
-
101
-
102
-
103
-
104
-
105
-
106
-
107
-
108
-
109
-
110
-
111
-
112
-
113
-
114
-
115
-
116
-
117
-
118
-
119
-
120
-
121
-
122
-
123
-
124
-
125
-
126
-
127
-
128
-
129
-
130
-
131
-
132
-
133
-
134
-
135
-
136
-
137
-
138
-
139
-
140
-
141
-
142
-
143
-
144
-
145
-
146
-
147
-
148
 |
 |

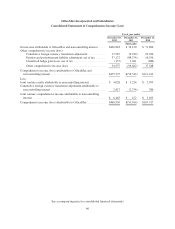
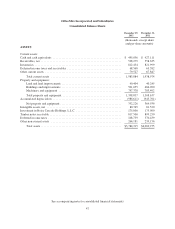
OfficeMax Incorporated and Subsidiaries
Consolidated Statements of Equity
For the fiscal years ended December 29, 2012, December 31, 2011 and December 25, 2010
Common
Shares
Outstanding
Preferred
Stock
Common
Stock
Additional
Paid-In
Capital
Retained
Earnings
(Accumulated
Deficit)
Accumulated
Other
Comprehensive
Income (Loss)
Total
OfficeMax
Share-
holders’
Equity
Non-
controlling
Interest
(thousands, except share amounts)
84,624,726 Balance at December 26,
2009 ................... $36,479 $211,562 $ 989,912 $(602,242) $(132,515) $ 503,196 $ 28,059
Comprehensive income:
Net income ................ — — — 71,155 — 71,155 2,709
Cumulative foreign currency
translation adjustment ...... 21,290 21,290 786
Pension and postretirement
liability adjustment, net of
tax..................... 16,356 16,356 —
Unrealized hedge loss, net of
tax..................... (884) (884) —
Preferred stock dividend
declared ................ — — — (2,527) (2,527) —
950 Restricted stock unit activity . . — — 7,972 — — 7,972 —
Non-controlling interest fair
value adjustment .......... — — (17,763) — — (17,763) 17,763
408,519 Stock options exercised ...... — 1,021 940 — — 1,961 —
23,515 Other ..................... (5,578) 61 5,518 8 — 9 (71)
85,057,710 Balance at December 25,
2010 ................... $30,901 $212,644 $ 986,579 $(533,606) $ (95,753) $ 600,765 $ 49,246
Comprehensive income:
Net income ................ — — — 34,894 — 34,894 3,226
Cumulative foreign currency
translation adjustment ...... (6,195) (6,195) (2,754)
Pension and postretirement
liability adjustment, net of
tax..................... (88,754) (88,754) —
Unrealized hedge loss, net of
tax..................... 1,041 1,041 —
Preferred stock dividend
declared ................ — — — (2,123) — (2,123) —
685,373 Restricted stock unit activity . . — 1,711 3,908 — — 5,619 —
Non-controlling interest fair
value adjustment .......... — — 17,763 — — 17,763 (17,763)
405,988 Stock options exercised ...... — 1,015 934 — — 1,949 —
9,591 Other ..................... (2,175) 27 6,190 (8) — 4,034 (32)
86,158,662 Balance at December 31,
2011 ................... $28,726 $215,397 $1,015,374 $(500,843) $(189,661) $ 568,993 $ 31,923
Comprehensive income:
Net income ................ — — — 416,790 — 416,790 4,028
Cumulative foreign currency
translation adjustment ...... 15,170 15,170 2,417
Pension and postretirement
liability adjustment, net of
tax..................... 37,127 37,127 —
Unrealized hedge loss, net of
tax..................... (157) (157) —
Cash dividend declared:
Common stock ............. — — — (5,217) — (5,217) —
Preferred stock ............. — — — (2,096) — (2,096) —
452,854 Restricted stock unit activity . . — 1,132 1,056 — — 2,188 —
Non-controlling interest fair
value adjustment .......... — — (6,253) — — (6,253) 6,253
212,441 Stock options exercised ...... — 531 498 — — 1,029 —
59,564 Other ..................... (1,335) 149 7,992 (7) — 6,799 (4)
86,883,521 Balance at December 29,
2012 ................... $27,391 $217,209 $1,018,667 $ (91,373) $(137,521) $1,034,373 $ 44,617
See accompanying notes to consolidated financial statements
50