OfficeMax 2012 Annual Report Download - page 107
Download and view the complete annual report
Please find page 107 of the 2012 OfficeMax annual report below. You can navigate through the pages in the report by either clicking on the pages listed below, or by using the keyword search tool below to find specific information within the annual report.-
 1
1 -
2
-
3
-
4
-
5
-
6
-
7
-
8
-
9
-
10
-
11
-
12
-
13
-
14
-
15
-
16
-
17
-
18
-
19
-
20
-
21
-
22
-
23
-
24
-
25
-
26
-
27
-
28
-
29
-
30
-
31
-
32
-
33
-
34
-
35
-
36
-
37
-
38
-
39
-
40
-
41
-
42
-
43
-
44
-
45
-
46
-
47
-
48
-
49
-
50
-
51
-
52
-
53
-
54
-
55
-
56
-
57
-
58
-
59
-
60
-
61
-
62
-
63
-
64
-
65
-
66
-
67
-
68
-
69
-
70
-
71
-
72
-
73
-
74
-
75
-
76
-
77
-
78
-
79
-
80
-
81
-
82
-
83
-
84
-
85
-
86
-
87
-
88
-
89
-
90
-
91
-
92
-
93
-
94
-
95
-
96
-
 97
97 -
 98
98 -
 99
99 -
 100
100 -
 101
101 -
 102
102 -
 103
103 -
 104
104 -
 105
105 -
 106
106 -
 107
107 -
 108
108 -
 109
109 -
 110
110 -
 111
111 -
 112
112 -
 113
113 -
 114
114 -
 115
115 -
 116
116 -
 117
117 -
118
-
119
-
120
-
121
-
122
-
123
-
124
-
125
-
126
-
127
-
128
-
129
-
130
-
131
-
132
-
133
-
134
-
135
-
136
-
137
-
138
-
139
-
140
-
141
-
142
-
143
-
144
-
145
-
146
-
147
-
148
 |
 |

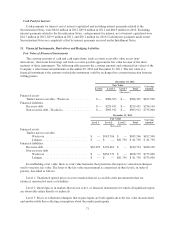
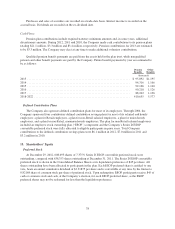
Cash Paid for Interest
Cash payments for interest, net of interest capitalized and including interest payments related to the
Securitization Notes, were $64.6 million in 2012, $69.8 million in 2011 and $68.9 million in 2010. Excluding
interest payments related to the Securitization Notes, cash payments for interest, net of interest capitalized were
$24.7 million in 2012, $29.9 million in 2011, and $29.1 million for 2010. Cash interest payments made on the
Securitization Notes are completely offset by interest payments received on the Installment Notes.
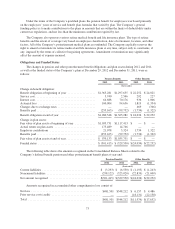
11. Financial Instruments, Derivatives and Hedging Activities
Fair Value of Financial Instruments
The carrying amounts of cash and cash equivalents, trade accounts receivable, other assets (non-
derivatives), short-term borrowings and trade accounts payable approximate fair value because of the short
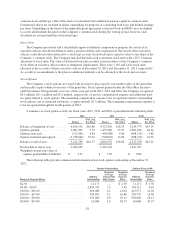
maturity of these instruments. The following table presents the carrying amounts and estimated fair values of the
Company’s other financial instruments at December 29, 2012 and December 31, 2011. The fair value of a
financial instrument is the amount at which the instrument could be exchanged in a current transaction between
willing parties.
December 29, 2012
Fair Value Carrying
AmountLevel 1 Level 2 Level 3 Total
(thousands)
Financial assets:
Timber notes receivable - Wachovia ............... $— $986,365 $ — $986,365 $817,500
Financial liabilities:
Recourse debt ................................. $— $229,431 $ — $229,431 $236,194
Non-recourse debt - Wachovia .................... $— $903,912 $ — $903,912 $735,000
December 31, 2011
Fair Value Carrying
AmountLevel 1 Level 2 Level 3 Total
(thousands)
Financial assets:
Timber notes receivable
Wachovia ............................. $ — $943,706 $ — $943,706 $817,500
Lehman ............................... $ — $ — $81,750 $ 81,750 $ 81,750
Financial liabilities:
Recourse debt .............................. $62,293 $178,461 $ — $240,754 $268,190
Non-recourse debt
Wachovia ............................. $ — $858,779 $ — $858,779 $735,000
Lehman ............................... $ — $ — $81,750 $ 81,750 $735,000
In establishing a fair value, there is a fair value hierarchy that prioritizes the inputs to valuation techniques
used to measure fair value. The basis of the fair value measurement is categorized in three levels, in order of
priority, described as follows:
Level 1: Unadjusted quoted prices in active markets that are accessible at the measurement date for
identical, unrestricted assets or liabilities.
Level 2: Quoted prices in markets that are not active, or financial instruments for which all significant inputs
are observable either directly or indirectly.
Level 3: Prices or valuation techniques that require inputs are both significant to the fair value measurement
and unobservable thus reflecting assumptions about the market participants.
71