OfficeMax 2012 Annual Report Download - page 61
Download and view the complete annual report
Please find page 61 of the 2012 OfficeMax annual report below. You can navigate through the pages in the report by either clicking on the pages listed below, or by using the keyword search tool below to find specific information within the annual report.-
 1
1 -
2
-
3
-
4
-
5
-
6
-
7
-
8
-
9
-
10
-
11
-
12
-
13
-
14
-
15
-
16
-
17
-
18
-
19
-
20
-
21
-
22
-
23
-
24
-
25
-
26
-
27
-
28
-
29
-
30
-
31
-
32
-
33
-
34
-
35
-
36
-
37
-
38
-
39
-
40
-
41
-
42
-
43
-
44
-
45
-
46
-
47
-
48
-
49
-
50
-
 51
51 -
 52
52 -
 53
53 -
 54
54 -
 55
55 -
 56
56 -
 57
57 -
 58
58 -
 59
59 -
 60
60 -
 61
61 -
 62
62 -
 63
63 -
 64
64 -
 65
65 -
 66
66 -
 67
67 -
 68
68 -
 69
69 -
 70
70 -
 71
71 -
72
-
73
-
74
-
75
-
76
-
77
-
78
-
79
-
80
-
81
-
82
-
83
-
84
-
85
-
86
-
87
-
88
-
89
-
90
-
91
-
92
-
93
-
94
-
95
-
96
-
97
-
98
-
99
-
100
-
101
-
102
-
103
-
104
-
105
-
106
-
107
-
108
-
109
-
110
-
111
-
112
-
113
-
114
-
115
-
116
-
117
-
118
-
119
-
120
-
121
-
122
-
123
-
124
-
125
-
126
-
127
-
128
-
129
-
130
-
131
-
132
-
133
-
134
-
135
-
136
-
137
-
138
-
139
-
140
-
141
-
142
-
143
-
144
-
145
-
146
-
147
-
148
 |
 |
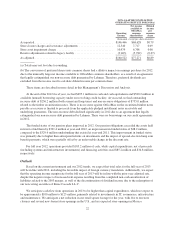
In addition, our results for 2010 include several significant items, as follows:
• We recognized a non-cash impairment charge of $11.0 million associated with leasehold improvements
and other assets at certain of our Retail stores in the U.S. After tax, this charge reduced net income
available to OfficeMax common shareholders by $6.7 million, or $0.08 per diluted share.
• We recorded $13.1 million of charges in our Retail segment related to store closures in the U.S offset
by income of $0.6 million in our Retail segment to adjust previously established severance reserves.
After tax, the cumulative effect of these items was a reduction of net income available to OfficeMax
common shareholders of $7.8 million, or $0.09 per diluted share.
• We recorded income of $9.4 million related to the adjustment of a reserve associated with our legacy
building materials manufacturing facility near Elma, Washington due to the sale of the facility’s
equipment and the termination of the lease. This item increased net income available to OfficeMax
common shareholders by $5.8 million, or $0.07 per diluted share.
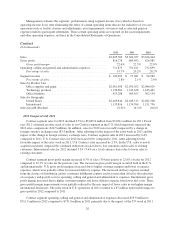
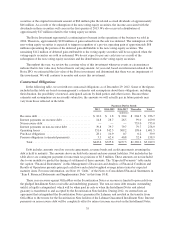
Interest income was $44.0 million and $42.6 million for 2011 and 2010, respectively. The increase was due
primarily to increases in cash balances and interest rates in our international businesses. Interest expense was
$73.1 million and $73.3 million in 2011 and 2010, respectively.
For 2011, we recognized income tax expense of $19.5 million on pre-tax income of $57.6 million (an
effective tax expense rate of 33.9%) compared to income tax expense of $41.9 million on pre-tax income of
$115.7 million (an effective tax expense rate of 36.2%) for 2010. The effective tax rate in both years was
impacted by the effects of state income taxes, income items not subject to tax, non-deductible expenses and the
mix of domestic and foreign sources of income. In 2011, the Company recorded an increase ($10.8 million) to
the valuation allowances relating to several state net operating losses. This negative impact was offset by other
one time favorable rate changes and other items related to nontaxable permanent items.
We reported net income attributable to OfficeMax and noncontrolling interest of $38.1 million for 2011.
After adjusting for joint venture earnings attributable to noncontrolling interest and preferred dividends, we
reported net income available to OfficeMax common shareholders of $32.8 million, or $0.38 per diluted share.
Adjusted net income available to OfficeMax common shareholders, as discussed above, was $53.3 million, or
$0.61 per diluted share, for 2011 compared to $77.3 million, or $0.89 per diluted share, for 2010.
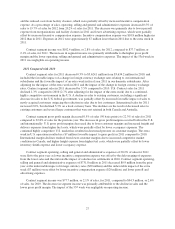
Segment Discussion
We report our results using three reportable segments: Contract; Retail; and Corporate and Other.
Contract distributes a broad line of items for the office, including office supplies and paper, technology
products and solutions, office furniture, print and document services and facilities products. Contract sells
directly to large corporate and government offices, as well as to small and medium-sized offices in the United
States, Canada, Australia and New Zealand. This segment markets and sells through field salespeople, outbound
telesales, catalogs, the Internet and in some markets, including Canada, Australia and New Zealand, through
office products stores.
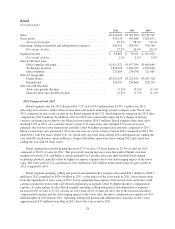
Retail is a retail distributor of office supplies and paper, print and document services, technology products
and solutions, office furniture and facilities products. In addition, this segment contracts with large national retail
chains to supply office and school supplies to be sold in their stores. Retail office supply stores feature
OfficeMax ImPress, an in-store module devoted to print-for-pay and related services. Retail has operations in the
United States, Puerto Rico and the U.S. Virgin Islands. Retail also operates office products stores in Mexico
through a 51%-owned joint venture, Grupo OfficeMax S. de R.L. de C.V. (“Grupo OfficeMax”).
Corporate and Other includes corporate support staff services and certain other legacy expenses as well as
the related assets and liabilities. The income and expense related to certain assets and liabilities that are reported
in the Corporate and Other segment have been allocated to the Contract and Retail segments.
25