OfficeMax 2012 Annual Report Download - page 100
Download and view the complete annual report
Please find page 100 of the 2012 OfficeMax annual report below. You can navigate through the pages in the report by either clicking on the pages listed below, or by using the keyword search tool below to find specific information within the annual report.-
 1
1 -
2
-
3
-
4
-
5
-
6
-
7
-
8
-
9
-
10
-
11
-
12
-
13
-
14
-
15
-
16
-
17
-
18
-
19
-
20
-
21
-
22
-
23
-
24
-
25
-
26
-
27
-
28
-
29
-
30
-
31
-
32
-
33
-
34
-
35
-
36
-
37
-
38
-
39
-
40
-
41
-
42
-
43
-
44
-
45
-
46
-
47
-
48
-
49
-
50
-
51
-
52
-
53
-
54
-
55
-
56
-
57
-
58
-
59
-
60
-
61
-
62
-
63
-
64
-
65
-
66
-
67
-
68
-
69
-
70
-
71
-
72
-
73
-
74
-
75
-
76
-
77
-
78
-
79
-
80
-
81
-
82
-
83
-
84
-
85
-
86
-
87
-
88
-
89
-
 90
90 -
 91
91 -
 92
92 -
 93
93 -
 94
94 -
 95
95 -
 96
96 -
 97
97 -
 98
98 -
 99
99 -
 100
100 -
 101
101 -
 102
102 -
 103
103 -
 104
104 -
 105
105 -
 106
106 -
 107
107 -
 108
108 -
 109
109 -
 110
110 -
111
-
112
-
113
-
114
-
115
-
116
-
117
-
118
-
119
-
120
-
121
-
122
-
123
-
124
-
125
-
126
-
127
-
128
-
129
-
130
-
131
-
132
-
133
-
134
-
135
-
136
-
137
-
138
-
139
-
140
-
141
-
142
-
143
-
144
-
145
-
146
-
147
-
148
 |
 |

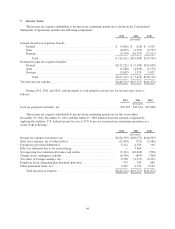
7. Income Taxes
The income tax expense attributable to income from continuing operations as shown in the Consolidated
Statements of Operations includes the following components:
2012 2011 2010
(thousands)
Current income tax (expense) benefit:
Federal .................................................... $ (3,806) $ (128) $ 9,507
State ...................................................... (8,075) (1,593) (2,735)
Foreign .................................................... (9,730) (10,377) (22,521)
Total .................................................. $ (21,611) $(12,098) $(15,749)
Deferred income tax (expense) benefit:
Federal .................................................... $(212,221) $ (5,342) $(24,628)
State ...................................................... (9,288) (4,056) (2,552)
Foreign .................................................... (5,602) 1,979 1,057
Total .................................................. $(227,111) $ (7,419) $(26,123)
Total income tax expense .......................................... $(248,722) $(19,517) $(41,872)
During 2012, 2011 and 2010, cash payments or cash refunds received, net, for income taxes were as
follows:
2012 2011 2010
(thousands)
Cash tax payments (refunds), net ....................................... $35,367 $13,524 $(5,026)
The income tax expense attributable to income from continuing operations for the years ended
December 29, 2012, December 31, 2011 and December 25, 2010 differed from the amounts computed by
applying the statutory U.S. federal income tax rate of 35% to pre-tax income from continuing operations as a
result of the following:
2012 2011 2010
(thousands)
Income tax expense at statutory rate ................................. $(234,339) $(20,173) $(40,507)
State taxes expense, net of federal effect .............................. (22,434) (723) (2,346)
Foreign tax provision differential .................................... 6,222 4,354 338
Effect on deferreds due to tax restructuring ............................ — 5,960 —
Net operating loss valuation allowance and credits ...................... (5,121) (10,818) (590)
Change in tax contingency liability .................................. (4,336) (695) (308)
Tax effect of foreign earnings, net ................................... 6,728 (2,517) (2,291)
Employee stock ownership plan dividend deduction ..................... 733 743 885
Other permanent items, net ........................................ 3,825 4,352 2,947
Total income tax expense ...................................... $(248,722) $(19,517) $(41,872)
64