OfficeMax 2012 Annual Report Download - page 117
Download and view the complete annual report
Please find page 117 of the 2012 OfficeMax annual report below. You can navigate through the pages in the report by either clicking on the pages listed below, or by using the keyword search tool below to find specific information within the annual report.-
 1
1 -
2
-
3
-
4
-
5
-
6
-
7
-
8
-
9
-
10
-
11
-
12
-
13
-
14
-
15
-
16
-
17
-
18
-
19
-
20
-
21
-
22
-
23
-
24
-
25
-
26
-
27
-
28
-
29
-
30
-
31
-
32
-
33
-
34
-
35
-
36
-
37
-
38
-
39
-
40
-
41
-
42
-
43
-
44
-
45
-
46
-
47
-
48
-
49
-
50
-
51
-
52
-
53
-
54
-
55
-
56
-
57
-
58
-
59
-
60
-
61
-
62
-
63
-
64
-
65
-
66
-
67
-
68
-
69
-
70
-
71
-
72
-
73
-
74
-
75
-
76
-
77
-
78
-
79
-
80
-
81
-
82
-
83
-
84
-
85
-
86
-
87
-
88
-
89
-
90
-
91
-
92
-
93
-
94
-
95
-
96
-
97
-
98
-
99
-
100
-
101
-
102
-
103
-
104
-
105
-
106
-
 107
107 -
 108
108 -
 109
109 -
 110
110 -
 111
111 -
 112
112 -
 113
113 -
 114
114 -
 115
115 -
 116
116 -
 117
117 -
 118
118 -
 119
119 -
 120
120 -
 121
121 -
 122
122 -
 123
123 -
 124
124 -
 125
125 -
 126
126 -
 127
127 -
128
-
129
-
130
-
131
-
132
-
133
-
134
-
135
-
136
-
137
-
138
-
139
-
140
-
141
-
142
-
143
-
144
-
145
-
146
-
147
-
148
 |
 |

common stock and the par value of the stock is reclassified from additional paid-in-capital to common stock.
Unrestricted shares are included in shares outstanding for purposes of calculating both basic and diluted earnings
per share. Depending on the terms of the applicable grant agreement, restricted stock and RSUs may be eligible
to accrue all dividends declared on the Company’s common stock during the vesting period; however, such
dividends are not paid until the restrictions lapse.
Stock Units
The Company previously had a shareholder approved deferred compensation program for certain of its
executive officers that allowed them to defer a portion of their cash compensation. Previously, these executive
officers could allocate their deferrals to a stock unit account. Each stock unit is equal in value to one share of the
Company’s common stock. The Company matched deferrals used to purchase stock units with a 25% Company
allocation of stock units. The value of deferred stock unit accounts is paid in shares of the Company’s common
stock when an executive officer retires or terminates employment. There were 1,185 and 2,441 stock units
allocated to the accounts of these executive officers at December 29, 2012 and December 31, 2011, respectively.
As a result of an amendment to the plan, no additional deferrals can be allocated to the stock unit accounts.
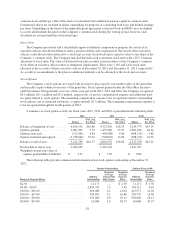
Stock Options
The Company’s stock options are issued with an exercise price equal to fair market value on the grant date
and typically expire within seven years of the grant date. Stock options granted under the OfficeMax Incentive
and Performance Plan generally vest over a three year period. In 2012, 2011 and 2010, the Company recognized
$8.1 million, $11.1 million and $5.2 million, respectively, of pre-tax compensation expense and additional paid-
in capital related to stock options. The remaining compensation expense to be recognized related to outstanding
stock options, net of estimated forfeitures, is approximately $5.3 million. The remaining compensation expense is
to be recognized through the fourth quarter of 2015.
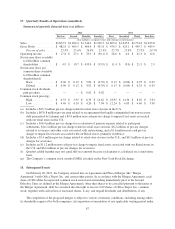
A summary of stock option activity for fiscal years 2012, 2011 and 2010 is presented in the following table:
2012 2011 2010
Shares
Wtd. Avg.
Ex. Price Shares
Wtd. Avg.
Ex. Price Shares
Wtd. Avg.
Ex. Price
Balance at beginning of year ....... 4,816,552 $16.86 4,313,290 $16.52 3,249,773 $15.14
Options granted ................. 2,087,453 5.72 1,457,280 13.33 2,060,246 16.24
Options exercised ................ (212,441) 4.84 (405,988) 4.80 (408,519) 4.80
Options forfeited and expired ...... (1,478,826) 25.03 (548,030) 13.80 (588,210) 16.02
Balance at end of year ............ 5,212,738 $10.57 4,816,552 $16.86 4,313,290 $16.52
Exercisable at end of year ......... 2,043,625 2,122,136 1,301,257
Weighted average fair value of
options granted (Black-Scholes) . . $ 3.27 $ 7.07 $ 8.08
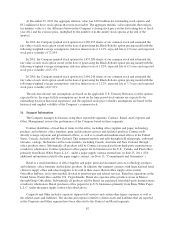
The following table provides summarized information about stock options outstanding at December 29,
2012:
Options Outstanding Options Exercisable
Range of Exercise Prices
Options
Outstanding
Weighted
Average
Contractual
Life (Years)
Weighted
Average
Exercise
Price
Options
Exercisable
Weighted
Average
Exercise
Price
$2.50 ...................................... 11,171 — $ 2.50 11,171 $ 2.50
$4.00 – $9.99 ................................ 2,839,791 5.5 5.50 705,713 4.83
$10.00 – $16.00 .............................. 666,084 4.2 14.04 423,971 14.26
$16.00 – $17.00 .............................. 704,692 5.1 16.86 236,770 16.86
$18.00 – $19.00 .............................. 975,000 4.9 18.15 650,000 18.15
$24.00 – $37.00 .............................. 16,000 1.6 30.37 16,000 30.37
81