OfficeMax 2012 Annual Report Download - page 113
Download and view the complete annual report
Please find page 113 of the 2012 OfficeMax annual report below. You can navigate through the pages in the report by either clicking on the pages listed below, or by using the keyword search tool below to find specific information within the annual report.-
 1
1 -
2
-
3
-
4
-
5
-
6
-
7
-
8
-
9
-
10
-
11
-
12
-
13
-
14
-
15
-
16
-
17
-
18
-
19
-
20
-
21
-
22
-
23
-
24
-
25
-
26
-
27
-
28
-
29
-
30
-
31
-
32
-
33
-
34
-
35
-
36
-
37
-
38
-
39
-
40
-
41
-
42
-
43
-
44
-
45
-
46
-
47
-
48
-
49
-
50
-
51
-
52
-
53
-
54
-
55
-
56
-
57
-
58
-
59
-
60
-
61
-
62
-
63
-
64
-
65
-
66
-
67
-
68
-
69
-
70
-
71
-
72
-
73
-
74
-
75
-
76
-
77
-
78
-
79
-
80
-
81
-
82
-
83
-
84
-
85
-
86
-
87
-
88
-
89
-
90
-
91
-
92
-
93
-
94
-
95
-
96
-
97
-
98
-
99
-
100
-
101
-
102
-
 103
103 -
 104
104 -
 105
105 -
 106
106 -
 107
107 -
 108
108 -
 109
109 -
 110
110 -
 111
111 -
 112
112 -
 113
113 -
 114
114 -
 115
115 -
 116
116 -
 117
117 -
 118
118 -
 119
119 -
 120
120 -
 121
121 -
 122
122 -
 123
123 -
124
-
125
-
126
-
127
-
128
-
129
-
130
-
131
-
132
-
133
-
134
-
135
-
136
-
137
-
138
-
139
-
140
-
141
-
142
-
143
-
144
-
145
-
146
-
147
-
148
 |
 |

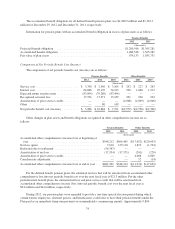
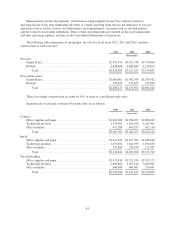
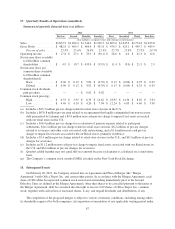
The following table presents the pension plan assets by level within the fair value hierarchy as of
December 29, 2012.
Level 1 Level 2 Level 3
(thousands)
Money market funds ................................................ $ — $ 26,244 $ —
Equity securities:
OfficeMax common stock ....................................... 16,232 — —
U.S. large-cap ................................................. 19,184 — —
U.S. small and mid-cap ......................................... 7,855 — —
International .................................................. 78,446 — —
Fixed-Income:
Corporate bonds ............................................... — 326,344 —
Government securities .......................................... — 13,378 —
Other fixed-income ............................................ — 29,286 —
Other:
Equity mutual funds ............................................ — 453,458 —
Group annuity contracts ......................................... — — 6,187
Other, including plan receivables and payables ....................... 2,519 — —
$124,236 $848,710 $6,187
The following table presents the pension plan assets by level within the fair value hierarchy as of
December 31, 2011.
Level 1 Level 2 Level 3
(thousands)
Money market funds ................................................ $ — $ 19,280 $ —
Equity securities:
OfficeMax common stock ....................................... 12,585 — —
U.S. large-cap ................................................. 53,629 — —
U.S. small and mid-cap ......................................... 13,529 — —
International .................................................. 84,647 — —
Fixed-Income:
Corporate bonds ............................................... — 421,027 —
Government securities .......................................... — 7,785 —
Other fixed-income ............................................ — 24,907 —
Other:
Equity mutual funds ............................................ — 385,862 —
Group annuity contracts ......................................... — — 5,662
Other, including plan receivables and payables ....................... 5,665 1,153 —
$170,055 $860,014 $5,662
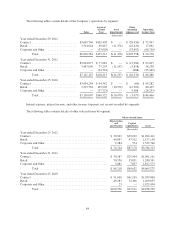
The following is a reconciliation of the change in fair value of the pension plan assets calculated based on
Level 3 inputs:
Total
(thousands)
Balance at December 31, 2011 ......................................................... $5,662
Benefit payments and administrative expenses ............................................ (9)
Invesment income and net appreciation in investments ...................................... 534
Balance at December 31, 2012 ......................................................... $6,187
77