OfficeMax 2012 Annual Report Download - page 111
Download and view the complete annual report
Please find page 111 of the 2012 OfficeMax annual report below. You can navigate through the pages in the report by either clicking on the pages listed below, or by using the keyword search tool below to find specific information within the annual report.-
 1
1 -
2
-
3
-
4
-
5
-
6
-
7
-
8
-
9
-
10
-
11
-
12
-
13
-
14
-
15
-
16
-
17
-
18
-
19
-
20
-
21
-
22
-
23
-
24
-
25
-
26
-
27
-
28
-
29
-
30
-
31
-
32
-
33
-
34
-
35
-
36
-
37
-
38
-
39
-
40
-
41
-
42
-
43
-
44
-
45
-
46
-
47
-
48
-
49
-
50
-
51
-
52
-
53
-
54
-
55
-
56
-
57
-
58
-
59
-
60
-
61
-
62
-
63
-
64
-
65
-
66
-
67
-
68
-
69
-
70
-
71
-
72
-
73
-
74
-
75
-
76
-
77
-
78
-
79
-
80
-
81
-
82
-
83
-
84
-
85
-
86
-
87
-
88
-
89
-
90
-
91
-
92
-
93
-
94
-
95
-
96
-
97
-
98
-
99
-
100
-
 101
101 -
 102
102 -
 103
103 -
 104
104 -
 105
105 -
 106
106 -
 107
107 -
 108
108 -
 109
109 -
 110
110 -
 111
111 -
 112
112 -
 113
113 -
 114
114 -
 115
115 -
 116
116 -
 117
117 -
 118
118 -
 119
119 -
 120
120 -
 121
121 -
122
-
123
-
124
-
125
-
126
-
127
-
128
-
129
-
130
-
131
-
132
-
133
-
134
-
135
-
136
-
137
-
138
-
139
-
140
-
141
-
142
-
143
-
144
-
145
-
146
-
147
-
148
 |
 |

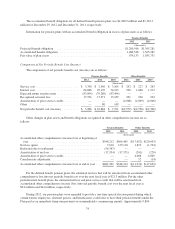
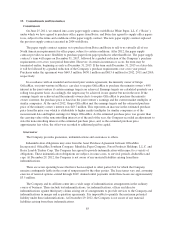
participants were eligible to elect an immediate lump sum payment or annuity. Of those participants eligible,
approximately 300 elected an annuity while approximately 5,600 elected an immediate lump sum payment. The
associated distributions by the pension plans from plan funds were approximately $150 million, and resulted in a
non-cash pre-tax charge by the Company of $56 million to expense the accumulated loss relating to these
participants that otherwise would have been amortized over their life expectancies. This action reduced the
pension benefit obligation liability by approximately $190 million.
Assumptions
The assumptions used in accounting for the Company’s plans are estimates of factors including, among
other things, the amount and timing of future benefit payments. The following table presents the key weighted
average assumptions used in the measurement of the Company’s benefit obligations as of year-end:
Other Benefits
Pension Benefits United States Canada
2012 2011 2012 2011 2012 2011
Discount rate ............................................. 3.88% 4.93% 3.10% 3.70% 4.00% 4.50%
The following table presents the weighted average assumptions used in the measurement of net periodic
benefit cost as of year-end:
Other Benefits
Pension Benefits United States Canada
2012 2011 2010 2012 2011 2010 2012 2011 2010
Discount rate .............................. 4.93% 5.64% 6.15% 3.70% 4.50% 5.10% 4.50% 5.30% 6.40%
Expected long-term return on plan
assets ................................... 8.20% 8.20% 8.20% ——————
The assumed discount rate (which is required to be the rate at which the projected benefit obligation could
be effectively settled as of the measurement date) is based on the rates of return for a theoretical portfolio of
high-grade corporate bonds (rated AA- or better) with cash flows that generally match our expected benefit
payments in future years. In selecting bonds for this theoretical portfolio, we focus on bonds that match cash
flows to benefit payments and limit our concentration of bonds by issuer. To the extent scheduled bond proceeds
exceed the estimated benefit payments in a given period, the yield calculation assumes those excess proceeds are
reinvested at an assumed forward rate. The implied forward rate used in the bond model is based on the Citigroup
Pension Discount Curve as of the last day of the year.
The expected long-term rate of return on plan assets assumption is based on the weighted average of
expected returns for the major asset classes in which the plans’ assets are held. Asset-class expected returns are
based on long-term historical returns, inflation expectations, forecasted gross domestic product and earnings
growth, as well as other economic factors. The weights assigned to each asset class are based on the Company’s
investment strategy. The weighted average expected return on plan assets used in the calculation of net periodic
pension benefit cost for 2013 is 7.8%.
Obligation and costs related to the Canadian retiree health plan are impacted by changes in trend rates.
75