OfficeMax 2012 Annual Report Download - page 62
Download and view the complete annual report
Please find page 62 of the 2012 OfficeMax annual report below. You can navigate through the pages in the report by either clicking on the pages listed below, or by using the keyword search tool below to find specific information within the annual report.-
 1
1 -
2
-
3
-
4
-
5
-
6
-
7
-
8
-
9
-
10
-
11
-
12
-
13
-
14
-
15
-
16
-
17
-
18
-
19
-
20
-
21
-
22
-
23
-
24
-
25
-
26
-
27
-
28
-
29
-
30
-
31
-
32
-
33
-
34
-
35
-
36
-
37
-
38
-
39
-
40
-
41
-
42
-
43
-
44
-
45
-
46
-
47
-
48
-
49
-
50
-
51
-
 52
52 -
 53
53 -
 54
54 -
 55
55 -
 56
56 -
 57
57 -
 58
58 -
 59
59 -
 60
60 -
 61
61 -
 62
62 -
 63
63 -
 64
64 -
 65
65 -
 66
66 -
 67
67 -
 68
68 -
 69
69 -
 70
70 -
 71
71 -
 72
72 -
73
-
74
-
75
-
76
-
77
-
78
-
79
-
80
-
81
-
82
-
83
-
84
-
85
-
86
-
87
-
88
-
89
-
90
-
91
-
92
-
93
-
94
-
95
-
96
-
97
-
98
-
99
-
100
-
101
-
102
-
103
-
104
-
105
-
106
-
107
-
108
-
109
-
110
-
111
-
112
-
113
-
114
-
115
-
116
-
117
-
118
-
119
-
120
-
121
-
122
-
123
-
124
-
125
-
126
-
127
-
128
-
129
-
130
-
131
-
132
-
133
-
134
-
135
-
136
-
137
-
138
-
139
-
140
-
141
-
142
-
143
-
144
-
145
-
146
-
147
-
148
 |
 |

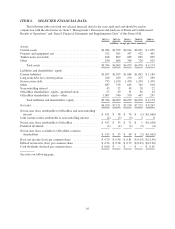
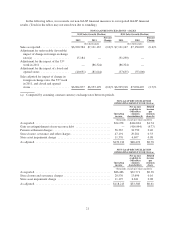
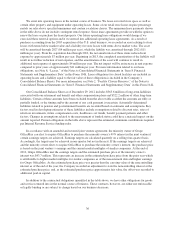
Management evaluates the segments’ performances using segment income (loss) which is based on
operating income (loss) after eliminating the effect of certain operating items that are not indicative of our core
operations such as facility closures and adjustments, asset impairments, severances and accelerated pension
expense related to participant settlements. These certain operating items are reported on the asset impairments
and other operating expenses, net lines in the Consolidated Statements of Operations.
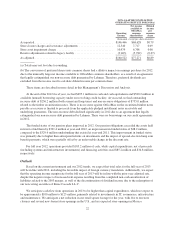
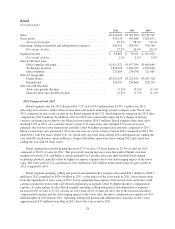
Contract
($ in thousands)
2012 2011 2010
Sales ..................................................... $3,605,760 $3,624,077 $3,634,244
Gross profit ................................................ 814,278 809,492 826,981
Gross profit margin ...................................... 22.6% 22.3% 22.8%
Operating, selling and general and administrative expenses .......... 711,875 731,811 732,699
Percentage of sales ...................................... 19.7% 20.2% 20.2%
Segment income ............................................ $ 102,403 $ 77,681 $ 94,282
Percentage of sales ...................................... 2.8% 2.1% 2.6%
Sales by Product Line
Office supplies and paper ................................. $2,061,908 $2,076,052 $2,086,629
Technology products ..................................... 1,130,564 1,142,168 1,185,461
Office furniture ......................................... 413,288 405,857 362,154
Sales by Geography
United States ........................................... $2,469,944 $2,449,313 $2,482,508
International ........................................... 1,135,816 1,174,764 1,151,736
Sales Growth (Decline) ....................................... (0.5)% (0.3)% (0.6)%
2012 Compared with 2011
Contract segment sales for 2012 declined 0.5% to $3,605.8 million from $3,624.1 million for 2011. Fiscal
year 2011 contained an extra week of sales in our Contract segment in the U.S. which negatively impacted the
2012 sales comparisons ($34.5 million). In addition, sales for 2012 were favorably impacted by a change in
foreign currency exchange rates ($3.4 million). After adjusting for the impact of the extra week in 2011 and the
impact of the change in foreign currency exchange rates, Contract segment sales in 2012 increased by 0.4%
compared to 2011. U.S. Contract sales for 2012 increased 0.8% compared to 2011. After adjusting for the
favorable impact of the extra week in 2011, U.S. Contract sales increased by 2.3%. In the U.S., sales to newly
acquired customers outpaced the combined reductions in sales due to lost customers and in sales to existing
customers. International sales for 2012 declined 3.3% (3.6% on a local currency basis) due to lower sales to
existing customers.
Contract segment gross profit margin increased 0.3% of sales (30 basis points) to 22.6% of sales for 2012
compared to 22.3% of sales for the previous year. The increase in gross profit margin occurred both in the U.S.
and internationally. U.S. gross profit margins increased due to higher customer margins and lower occupancy
expenses, which were partially offset by increased delivery expense. The increased delivery expense resulted
from the closure of distribution centers (customer fulfillment centers) and was more than offset by the reduction
of occupancy and payroll costs in operating, selling and general and administrative expenses. International gross
profit margin increased due to higher customer margins and lower delivery expense from lower fuel costs. These
gross profit margin improvements were partially reduced by the mix impact of lower sales in our higher-margin
international businesses. The extra week in U.S. operations in 2011 resulted in a $7 million unfavorable impact to
gross profit in 2012 compared to 2011.
Contract segment operating, selling and general and administrative expenses decreased $19.9 million to
$711.9 million in 2012 compared to $731.8 million in 2011 primarily due to the impact of the 53rd week in 2011
26