OfficeMax 2012 Annual Report Download - page 81
Download and view the complete annual report
Please find page 81 of the 2012 OfficeMax annual report below. You can navigate through the pages in the report by either clicking on the pages listed below, or by using the keyword search tool below to find specific information within the annual report.-
 1
1 -
2
-
3
-
4
-
5
-
6
-
7
-
8
-
9
-
10
-
11
-
12
-
13
-
14
-
15
-
16
-
17
-
18
-
19
-
20
-
21
-
22
-
23
-
24
-
25
-
26
-
27
-
28
-
29
-
30
-
31
-
32
-
33
-
34
-
35
-
36
-
37
-
38
-
39
-
40
-
41
-
42
-
43
-
44
-
45
-
46
-
47
-
48
-
49
-
50
-
51
-
52
-
53
-
54
-
55
-
56
-
57
-
58
-
59
-
60
-
61
-
62
-
63
-
64
-
65
-
66
-
67
-
68
-
69
-
70
-
 71
71 -
 72
72 -
 73
73 -
 74
74 -
 75
75 -
 76
76 -
 77
77 -
 78
78 -
 79
79 -
 80
80 -
 81
81 -
 82
82 -
 83
83 -
 84
84 -
 85
85 -
 86
86 -
 87
87 -
 88
88 -
 89
89 -
 90
90 -
 91
91 -
92
-
93
-
94
-
95
-
96
-
97
-
98
-
99
-
100
-
101
-
102
-
103
-
104
-
105
-
106
-
107
-
108
-
109
-
110
-
111
-
112
-
113
-
114
-
115
-
116
-
117
-
118
-
119
-
120
-
121
-
122
-
123
-
124
-
125
-
126
-
127
-
128
-
129
-
130
-
131
-
132
-
133
-
134
-
135
-
136
-
137
-
138
-
139
-
140
-
141
-
142
-
143
-
144
-
145
-
146
-
147
-
148
 |
 |

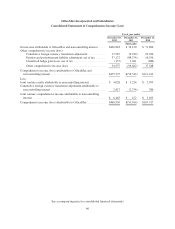
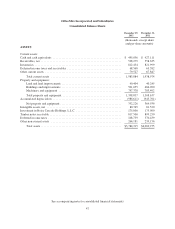
ITEM 8. FINANCIAL STATEMENTS AND SUPPLEMENTARY DATA
OfficeMax Incorporated and Subsidiaries
Consolidated Statements of Operations
Fiscal year ended
December 29,
2012
December 31,
2011
December 25,
2010
(thousands, except per-share amounts)
Sales .................................................... $6,920,384 $7,121,167 $7,150,007
Cost of goods sold and occupancy costs ......................... 5,135,927 5,311,987 5,300,355
Gross profit ........................................... 1,784,457 1,809,180 1,849,652
Operating expenses
Operating, selling, and general and administrative expenses ..... 1,645,245 1,690,967 1,689,130
Asset impairments ...................................... 11,376 11,197 10,979
Other operating expenses, net ............................. 103,558 20,530 3,077
Operating income ...................................... 24,278 86,486 146,466
Interest expense ............................................ (69,765) (73,136) (73,333)
Interest income ............................................ 43,772 44,000 42,635
Gain on extinguishment of non-recourse debt .................... 670,766 — —
Other income (expense), net .................................. 489 287 (32)
Pre-tax income ......................................... 669,540 57,637 115,736
Income tax expense ......................................... (248,722) (19,517) (41,872)
Net income attributable to OfficeMax and noncontrolling
interest ............................................. 420,818 38,120 73,864
Joint venture results attributable to noncontrolling interest .......... (4,028) (3,226) (2,709)
Net income attributable to OfficeMax .......................... $ 416,790 $ 34,894 $ 71,155
Preferred dividends ......................................... (2,096) (2,123) (2,527)
Net income available to OfficeMax common shareholders .......... $ 414,694 $ 32,771 $ 68,628
Net income per common share
Basic ................................................ $ 4.79 $ 0.38 $ 0.81
Diluted ............................................... $ 4.74 $ 0.38 $ 0.79
See accompanying notes to consolidated financial statements
45