OfficeMax 2012 Annual Report Download - page 63
Download and view the complete annual report
Please find page 63 of the 2012 OfficeMax annual report below. You can navigate through the pages in the report by either clicking on the pages listed below, or by using the keyword search tool below to find specific information within the annual report.-
 1
1 -
2
-
3
-
4
-
5
-
6
-
7
-
8
-
9
-
10
-
11
-
12
-
13
-
14
-
15
-
16
-
17
-
18
-
19
-
20
-
21
-
22
-
23
-
24
-
25
-
26
-
27
-
28
-
29
-
30
-
31
-
32
-
33
-
34
-
35
-
36
-
37
-
38
-
39
-
40
-
41
-
42
-
43
-
44
-
45
-
46
-
47
-
48
-
49
-
50
-
51
-
52
-
 53
53 -
 54
54 -
 55
55 -
 56
56 -
 57
57 -
 58
58 -
 59
59 -
 60
60 -
 61
61 -
 62
62 -
 63
63 -
 64
64 -
 65
65 -
 66
66 -
 67
67 -
 68
68 -
 69
69 -
 70
70 -
 71
71 -
 72
72 -
 73
73 -
74
-
75
-
76
-
77
-
78
-
79
-
80
-
81
-
82
-
83
-
84
-
85
-
86
-
87
-
88
-
89
-
90
-
91
-
92
-
93
-
94
-
95
-
96
-
97
-
98
-
99
-
100
-
101
-
102
-
103
-
104
-
105
-
106
-
107
-
108
-
109
-
110
-
111
-
112
-
113
-
114
-
115
-
116
-
117
-
118
-
119
-
120
-
121
-
122
-
123
-
124
-
125
-
126
-
127
-
128
-
129
-
130
-
131
-
132
-
133
-
134
-
135
-
136
-
137
-
138
-
139
-
140
-
141
-
142
-
143
-
144
-
145
-
146
-
147
-
148
 |
 |
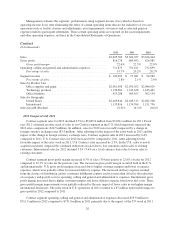
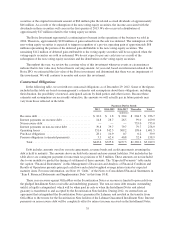
and the reduced costs from facility closures, which were partially offset by increased incentive compensation
expense. As a percentage of sales, operating, selling and general and administrative expenses decreased 0.5% of
sales to 19.7% of sales for 2012 from 20.2% of sales for 2011. The decrease was primarily due to lower payroll
expense from reorganizations and facility closures in 2011 and lower advertising expense, which were partially
offset by increased incentive compensation expense. Incentive compensation expense was $10.8 million higher in
2012 than in 2011. Expenses in 2012 were approximately $7 million lower than in 2011 due to the extra week in
2011.
Contract segment income was $102.4 million, or 2.8% of sales, for 2012, compared to $77.7 million, or
2.1% of sales, for 2011. The increase in segment income was primarily attributable to the higher gross profit
margin and the lower operating, selling and general and administrative expenses. The impact of the 53rd week in
2011 was negligible on operating income.
2011 Compared with 2010
Contract segment sales for 2011 decreased 0.3% to $3,624.1 million from $3,634.2 million for 2010, and
included the favorable impact of a change in foreign currency exchange rates relating to our international
subsidiaries and the favorable impact of an extra week in fiscal year 2011 in our domestic subsidiaries. After
adjusting for the impact of the extra week in 2011 and the impact of the change in foreign currency exchange
rates, Contract segment sales in 2011 decreased by 3.5% compared to 2010. U.S. Contract sales for 2011
declined 1.3% compared to 2010 (2.7% after adjusting for the impact of the extra week) due to a continued,
highly competitive environment in the U.S. A decline in sales to existing customers, including a significant
decrease in sales to the U.S. federal government, was partially offset by increased favorable impact of sales to
newly acquired customers outpacing the reduction in sales due to lost customers. International sales for 2011
increased 2.0%, but declined 5.3% on a local currency basis. The declines are the result of decreased sales to
existing customers and several large customers that were not retained in both Canada and Australia.
Contract segment gross profit margin decreased 0.5% of sales (50 basis points) to 22.3% of sales for 2011
compared to 22.8% of sales for the previous year. The decrease in gross profit margins occurred both in the U.S.
and internationally. U.S. gross profit margins decreased due to lower customer margins and increased freight and
delivery expenses from higher fuel costs, which were partially offset by lower occupancy expenses. The
continued highly competitive U.S. market has resulted in downward pressure on customer margins. The extra
week in U.S. operations resulted in a $7 million favorable impact to gross profit in 2011 compared to 2010.
International margin declines resulted from lower customer margins due to increased competitive market
conditions in Canada, and higher freight expense from higher fuel costs, which were partially offset by lower
inventory shrink expense and lower occupancy expense.
Contract segment operating, selling and general and administrative expenses of 20.2% of sales for 2011
were flat to the prior year as lower incentive compensation expense was offset by the deleveraging of expenses
from the lower sales and the unfavorable impact of sales/use tax settlements in 2010. Contract segment operating,
selling and general and administrative expenses of $731.8 million in 2011 decreased $0.9 million from the prior
year as the unfavorable impact of foreign currency rates ($20 million) and the unfavorable impact of the extra
week ($7 million) were offset by lower incentive compensation expense ($20 million) and lower payroll and
advertising expenses.
Contract segment income was $77.7 million, or 2.1% of sales, for 2011, compared to $94.3 million, or 2.6%
of sales, for 2010. The decrease in segment income was primarily attributable to the decline in sales and the
lower gross profit margin. The impact of the 53rd week was negligible on operating income.
27