OfficeMax 2012 Annual Report Download - page 65
Download and view the complete annual report
Please find page 65 of the 2012 OfficeMax annual report below. You can navigate through the pages in the report by either clicking on the pages listed below, or by using the keyword search tool below to find specific information within the annual report.-
 1
1 -
2
-
3
-
4
-
5
-
6
-
7
-
8
-
9
-
10
-
11
-
12
-
13
-
14
-
15
-
16
-
17
-
18
-
19
-
20
-
21
-
22
-
23
-
24
-
25
-
26
-
27
-
28
-
29
-
30
-
31
-
32
-
33
-
34
-
35
-
36
-
37
-
38
-
39
-
40
-
41
-
42
-
43
-
44
-
45
-
46
-
47
-
48
-
49
-
50
-
51
-
52
-
53
-
54
-
 55
55 -
 56
56 -
 57
57 -
 58
58 -
 59
59 -
 60
60 -
 61
61 -
 62
62 -
 63
63 -
 64
64 -
 65
65 -
 66
66 -
 67
67 -
 68
68 -
 69
69 -
 70
70 -
 71
71 -
 72
72 -
 73
73 -
 74
74 -
 75
75 -
76
-
77
-
78
-
79
-
80
-
81
-
82
-
83
-
84
-
85
-
86
-
87
-
88
-
89
-
90
-
91
-
92
-
93
-
94
-
95
-
96
-
97
-
98
-
99
-
100
-
101
-
102
-
103
-
104
-
105
-
106
-
107
-
108
-
109
-
110
-
111
-
112
-
113
-
114
-
115
-
116
-
117
-
118
-
119
-
120
-
121
-
122
-
123
-
124
-
125
-
126
-
127
-
128
-
129
-
130
-
131
-
132
-
133
-
134
-
135
-
136
-
137
-
138
-
139
-
140
-
141
-
142
-
143
-
144
-
145
-
146
-
147
-
148
 |
 |
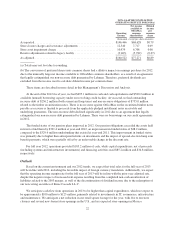
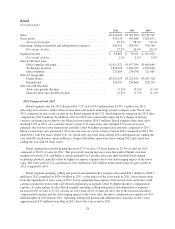
Retail segment income was $69.9 million, or 2.1% of sales, for 2012, compared to $75.3 million, or 2.2% of
sales, for 2011. The decrease in segment income was primarily attributable to the sales decline, which was
partially offset by the higher gross profit margins, the decreased operating expenses as noted above and the
continued improvement in our Mexican joint venture’s earnings. There was $8 million of segment income in
2011 resulting from the 53rd week.
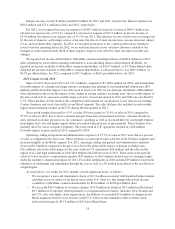
2011 Compared with 2010
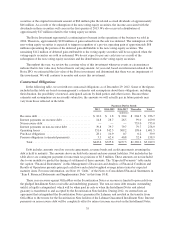
Retail segment sales for 2011 decreased by 0.5% to $3,497.1 million from $3,515.8 million for 2010, and
included the favorable impact of currency exchange rates relating to our Mexican joint venture ($8 million) and
the favorable impact of an extra week in fiscal year 2011 in our domestic subsidiaries ($52 million). The sales
declines reflect challenging economic conditions and an increased promotional environment as well as
significant decline in certain technology categories. Same-store sales declined by 1.7% in 2011 on a constant
currency basis, which included a U.S. same-store sales decline of 2.8%, partially offset by a 14.2% same-store
sales increase in Mexico, on a local currency basis. The U.S. same-store sales decline reflected weaker back-to-
school sales and continued weakness in store traffic, which was partially offset by slightly higher average ticket
and a favorable holiday season. We ended 2011 with 978 stores. In the U.S., we closed twenty-two retail stores
during 2011 and opened none, ending the year with 896 retail stores, while in Mexico, Grupo OfficeMax opened
five stores during 2011 and closed two, ending the year with 82 retail stores.
Retail segment gross profit margin decreased 0.5% of sales (50 basis points) to 28.6% of sales for 2011
compared to 29.1% of sales for 2010. The gross profit margin declines were the result of lower customer margins
in Mexico, higher freight and delivery expenses from increased fuel costs and higher inventory markdowns,
which were partially offset by lower occupancy expenses. We had slightly higher customer margins in the U.S.
reflecting the product-mix shift to supplies sales. Higher promotional activity resulted in increased sales but
placed continued pressure on margins. The extra week in U.S. operations resulted in a $21 million favorable
impact to gross profit in 2011 compared to 2010.
Retail segment operating, selling and general and administrative expenses increased 0.3% of sales to 26.4%
of sales for 2011 from 26.1% of sales for 2010 as lower incentive compensation expense was more than offset by
the deleveraging impact of the lower sales and the unfavorable impact of sales/use tax and legal settlements in
2010. Retail segment operating, selling and general and administrative expenses of $924.4 million in 2011
increased $5.6 million from the prior year as the unfavorable impact of the extra week ($13 million), the
unfavorable impact of sales/use tax and legal settlements in 2010 ($12 million) and the unfavorable impact of
foreign currency rates ($1 million) were partially offset by lower incentive compensation expense ($23 million).
In addition, lower advertising expense and lower store fixture and equipment-related costs were more than offset
by higher overhead associated with our profitability initiatives.
Retail segment income was $75.3 million, or 2.2% of sales, for 2011, compared to $103.9 million, or 3.0%
of sales, for 2010. The decrease in segment income was primarily attributable to the sales decline, the lower
gross profit margins and the increased operating expenses as noted above which was partially offset by continued
improvement in our Mexican joint venture’s earnings. There was $8 million of segment income resulting from
the 53rd week.
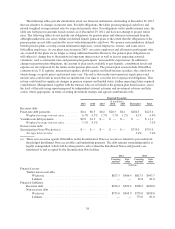
Corporate and Other
Corporate and Other segment loss was $33.1 million, $34.8 million and $37.7 million for 2012, 2011 and
2010, respectively. In 2012, compared to 2011, lower pension expense was partially offset by increased legacy
costs and legal fees, and the change in incentive compensation expense was not material. In 2011, the benefit of
lower incentive compensation expense was partially offset by increased pension expense compared to 2010.
29