OfficeMax 2012 Annual Report Download - page 59
Download and view the complete annual report
Please find page 59 of the 2012 OfficeMax annual report below. You can navigate through the pages in the report by either clicking on the pages listed below, or by using the keyword search tool below to find specific information within the annual report.-
 1
1 -
2
-
3
-
4
-
5
-
6
-
7
-
8
-
9
-
10
-
11
-
12
-
13
-
14
-
15
-
16
-
17
-
18
-
19
-
20
-
21
-
22
-
23
-
24
-
25
-
26
-
27
-
28
-
29
-
30
-
31
-
32
-
33
-
34
-
35
-
36
-
37
-
38
-
39
-
40
-
41
-
42
-
43
-
44
-
45
-
46
-
47
-
48
-
 49
49 -
 50
50 -
 51
51 -
 52
52 -
 53
53 -
 54
54 -
 55
55 -
 56
56 -
 57
57 -
 58
58 -
 59
59 -
 60
60 -
 61
61 -
 62
62 -
 63
63 -
 64
64 -
 65
65 -
 66
66 -
 67
67 -
 68
68 -
 69
69 -
70
-
71
-
72
-
73
-
74
-
75
-
76
-
77
-
78
-
79
-
80
-
81
-
82
-
83
-
84
-
85
-
86
-
87
-
88
-
89
-
90
-
91
-
92
-
93
-
94
-
95
-
96
-
97
-
98
-
99
-
100
-
101
-
102
-
103
-
104
-
105
-
106
-
107
-
108
-
109
-
110
-
111
-
112
-
113
-
114
-
115
-
116
-
117
-
118
-
119
-
120
-
121
-
122
-
123
-
124
-
125
-
126
-
127
-
128
-
129
-
130
-
131
-
132
-
133
-
134
-
135
-
136
-
137
-
138
-
139
-
140
-
141
-
142
-
143
-
144
-
145
-
146
-
147
-
148
 |
 |
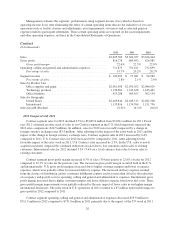
Operating Results
2012 Compared with 2011
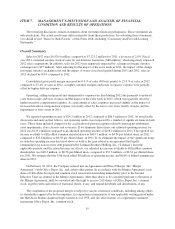
Sales for 2012 decreased 2.8% (2.6% on constant currency basis) year-over-year to $6,920.4 million. Fiscal
year 2011 contained an extra week of sales for our domestic businesses ($86 million), which negatively impacted
2012 sales comparisons. Sales for 2012 were also negatively impacted by a change in foreign currency exchange
rates ($15 million). After adjusting for the impact of the extra week in 2011, the impact of the change in foreign
currency exchange rates and the impact of stores closed and opened during 2011 and 2012, sales in 2012 declined
by 0.8% compared to 2011. Sales declined in both our Retail and Contract segments. In our Retail segment, U.S.
same-store sales declined 2.5% year-over-year, while Mexico same-store sales increased 1.6% year-over-year in
local currencies. In our Contract segment, U.S. sales increased 0.8% year-over-year (2.3% after adjusting for the
$35 million impact of the extra week in 2011), while international sales declined 3.6% in local currencies. The
overall sale declines are the result of the impact of the extra week in 2011, the competitive environment for our
products, lower sales to our existing international Contract customers, and weak store traffic in our Retail
segment, which were partially offset by stronger sales in our U.S Contract business and in Mexico.
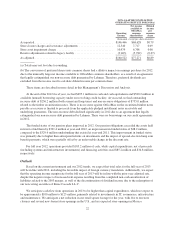
Gross profit margin increased by 0.4% of sales (40 basis points) to 25.8% of sales in 2012 compared to
25.4% of sales in 2011, as higher customer margins and lower occupancy expenses were partially offset by
higher delivery expense and the mix impact of lower sales in our higher-margin Retail segment. The extra week
in U.S. operations in 2011 resulted in a $28 million unfavorable impact to gross profit in 2012 compared to 2011.
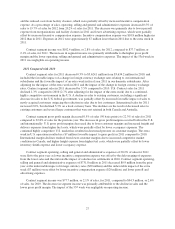
Operating, selling and general and administrative expenses decreased $45.7 million to $1,645.2 million for
2012 compared to $1,691.0 million for 2011 due primarily to the impact of the extra week in 2011 ($20 million
favorable) as well as reduced payroll expense from reorganizations and store and facility closures, lower
depreciation from the impairment of store assets in 2011, lower equipment lease expense from closed stores,
lower advertising expense and lower credit card processing fees resulting from credit card reform legislation,
which were partially offset by higher incentive compensation expense and higher legal expense. As a percentage
of sales, operating, selling and general and administrative expenses of 23.8% for 2012 were slightly higher
compared to 23.7% for 2011 as the impact of the higher incentive compensation expense was nearly offset by
reduced payroll expense from reorganizations and facility closures, lower depreciation expense from the
impairment of store assets in 2011, lower advertising expense and lower credit card processing fees. Incentive
compensation expense was $20 million higher in 2012 than in 2011 due to a higher level of performance under
the incentive compensation plans in 2012 than in 2011.
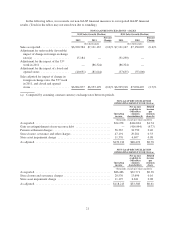
As noted above, our results for 2012 include several significant items, as follows:
• We recognized a non-cash impairment charge of $11.4 million associated with the impairment of
leasehold improvements and other assets at certain of our Retail stores, primarily in the U.S. After tax,
this charge reduced net income available to OfficeMax common shareholders by $6.7 million, or $0.08
per diluted share. This charge was included in asset impairments in the Consolidated Statements of
Operations.
• We recorded charges totaling $103.6 million associated with the acceleration of pension expense
related to participant settlements ($56.4 million), store closures in the U.S. ($41.0 million) and
severance and other charges ($6.2 million) primarily related to restructurings in Canada, Australia,
New Zealand and the U.S Contract business. After tax, the cumulative effect of these items reduced net
income by $64.0 million, or $0.73 per diluted share. These charges were included in other operating
expenses, net in the Consolidated Statements of Operations.
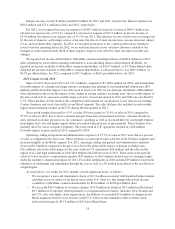
• We recorded a non-cash gain of $670.8 million related to an agreement that legally extinguished our
non-recourse debt guaranteed by Lehman. The gain increased net income available to OfficeMax
common shareholders by $416.9 or $4.77 per diluted share. This gain was included in gain on
extinguishment of non-recourse debt in our Consolidated Statements of Operations.
23