OfficeMax 2012 Annual Report Download - page 120
Download and view the complete annual report
Please find page 120 of the 2012 OfficeMax annual report below. You can navigate through the pages in the report by either clicking on the pages listed below, or by using the keyword search tool below to find specific information within the annual report.-
 1
1 -
2
-
3
-
4
-
5
-
6
-
7
-
8
-
9
-
10
-
11
-
12
-
13
-
14
-
15
-
16
-
17
-
18
-
19
-
20
-
21
-
22
-
23
-
24
-
25
-
26
-
27
-
28
-
29
-
30
-
31
-
32
-
33
-
34
-
35
-
36
-
37
-
38
-
39
-
40
-
41
-
42
-
43
-
44
-
45
-
46
-
47
-
48
-
49
-
50
-
51
-
52
-
53
-
54
-
55
-
56
-
57
-
58
-
59
-
60
-
61
-
62
-
63
-
64
-
65
-
66
-
67
-
68
-
69
-
70
-
71
-
72
-
73
-
74
-
75
-
76
-
77
-
78
-
79
-
80
-
81
-
82
-
83
-
84
-
85
-
86
-
87
-
88
-
89
-
90
-
91
-
92
-
93
-
94
-
95
-
96
-
97
-
98
-
99
-
100
-
101
-
102
-
103
-
104
-
105
-
106
-
107
-
108
-
109
-
 110
110 -
 111
111 -
 112
112 -
 113
113 -
 114
114 -
 115
115 -
 116
116 -
 117
117 -
 118
118 -
 119
119 -
 120
120 -
 121
121 -
 122
122 -
 123
123 -
 124
124 -
 125
125 -
 126
126 -
 127
127 -
 128
128 -
 129
129 -
 130
130 -
131
-
132
-
133
-
134
-
135
-
136
-
137
-
138
-
139
-
140
-
141
-
142
-
143
-
144
-
145
-
146
-
147
-
148
 |
 |

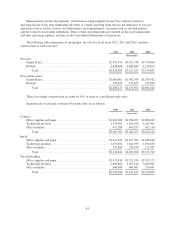
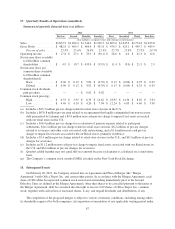
The following tables contain details of the Company’s operations by segment:
Sales
Segment
income
(loss)
Asset
impairments
Other
operating
expenses, net
Operating
income (loss)
(thousands)
Year ended December 29, 2012
Contract ............................... $3,605,760 $102,403 $ — $ (28,436) $ 73,967
Retail ................................. 3,314,624 69,867 (11,376) (41,430) 17,061
Corporate and Other ..................... — (33,058) — (33,692) (66,750)
Total .......................... $6,920,384 $139,212 $(11,376) $(103,558) $ 24,278
Year ended December 31, 2011
Contract ............................... $3,624,077 $ 77,681 $ — $ (13,984) $ 63,697
Retail ................................. 3,497,090 75,293 (11,197) (5,858) 58,238
Corporate and Other ..................... — (34,761) — (688) (35,449)
Total .......................... $7,121,167 $118,213 $(11,197) $ (20,530) $ 86,486
Year ended December 25, 2010
Contract ............................... $3,634,244 $ 94,342 $ — $ (60) $ 94,282
Retail ................................. 3,515,763 103,903 (10,979) (12,505) 80,419
Corporate and Other ..................... — (37,723) — 9,488 (28,235)
Total .......................... $7,150,007 $160,522 $(10,979) $ (3,077) $146,466
Interest expense, interest income, and other income (expense), net are not recorded by segments.
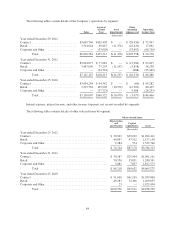
The following table contains details of other selected items by segment.
Other selected items
Depreciation
and
amortization
Capital
expenditures Assets
(thousands)
Year ended December 29, 2012
Contract ................................................... $ 30,943 $39,292 $1,094,411
Retail ..................................................... 40,897 47,312 1,157,158
Corporate and Other .......................................... 2,284 574 1,532,746
Total .............................................. $ 74,124 $87,178 $3,784,315
Year ended December 31, 2011
Contract ................................................... $ 30,587 $25,964 $1,001,161
Retail ..................................................... 50,550 35,831 1,240,541
Corporate and Other .......................................... 3,081 7,837 1,827,573
Total .............................................. $ 84,218 $69,632 $4,069,275
Year ended December 25, 2010
Contract ................................................... $ 51,630 $61,165 $1,039,800
Retail ..................................................... 49,283 32,346 1,209,635
Corporate and Other .......................................... 23 — 1,829,494
Total .............................................. $100,936 $93,511 $4,078,929
84