OfficeMax 2012 Annual Report Download - page 119
Download and view the complete annual report
Please find page 119 of the 2012 OfficeMax annual report below. You can navigate through the pages in the report by either clicking on the pages listed below, or by using the keyword search tool below to find specific information within the annual report.-
 1
1 -
2
-
3
-
4
-
5
-
6
-
7
-
8
-
9
-
10
-
11
-
12
-
13
-
14
-
15
-
16
-
17
-
18
-
19
-
20
-
21
-
22
-
23
-
24
-
25
-
26
-
27
-
28
-
29
-
30
-
31
-
32
-
33
-
34
-
35
-
36
-
37
-
38
-
39
-
40
-
41
-
42
-
43
-
44
-
45
-
46
-
47
-
48
-
49
-
50
-
51
-
52
-
53
-
54
-
55
-
56
-
57
-
58
-
59
-
60
-
61
-
62
-
63
-
64
-
65
-
66
-
67
-
68
-
69
-
70
-
71
-
72
-
73
-
74
-
75
-
76
-
77
-
78
-
79
-
80
-
81
-
82
-
83
-
84
-
85
-
86
-
87
-
88
-
89
-
90
-
91
-
92
-
93
-
94
-
95
-
96
-
97
-
98
-
99
-
100
-
101
-
102
-
103
-
104
-
105
-
106
-
107
-
108
-
 109
109 -
 110
110 -
 111
111 -
 112
112 -
 113
113 -
 114
114 -
 115
115 -
 116
116 -
 117
117 -
 118
118 -
 119
119 -
 120
120 -
 121
121 -
 122
122 -
 123
123 -
 124
124 -
 125
125 -
 126
126 -
 127
127 -
 128
128 -
 129
129 -
130
-
131
-
132
-
133
-
134
-
135
-
136
-
137
-
138
-
139
-
140
-
141
-
142
-
143
-
144
-
145
-
146
-
147
-
148
 |
 |

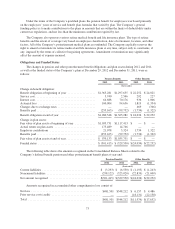
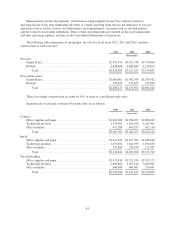
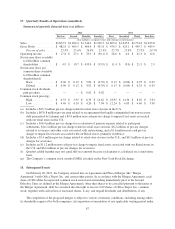
Management evaluates the segments’ performances using segment income (loss) which is based on
operating income (loss) after eliminating the effect of certain operating items that are not indicative of our core
operations such as facility closures and adjustments, asset impairments, severances and accelerated pension
expense related to participant settlements. These certain operating items are reported on the asset impairments
and other operating expenses, net lines in the Consolidated Statements of Operations.
The following table summarizes by geography, net sales for fiscal years 2012, 2011 and 2010, and non-
current assets at each year-end:
2012 2011 2010
(thousands)
Net sales
United States ........................................... $5,491,976 $5,671,738 $5,770,036
Foreign ............................................... 1,428,408 1,449,429 1,379,971
Total ............................................. $6,920,384 $7,121,167 $7,150,007
Non-current assets
United States ........................................... $1,660,961 $1,992,674 $1,924,982
Foreign ............................................... 139,470 137,627 139,661
Total ............................................. $1,800,431 $2,130,301 $2,064,643
There is no single customer that accounts for 10% or more of consolidated trade sales.
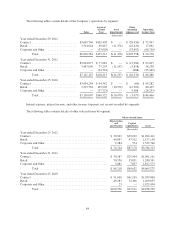
Segment sales to external customers by product line are as follows:
2012 2011 2010
(thousands)
Contract
Office supplies and paper ................................. $2,061,908 $2,076,052 $2,086,629
Technology products ..................................... 1,130,564 1,142,168 1,185,461
Office furniture ......................................... 413,288 405,857 362,154
Total ............................................. $3,605,760 $3,624,077 $3,634,244
Retail
Office supplies and paper ................................. $1,411,522 $1,437,304 $1,468,646
Technology products ..................................... 1,670,302 1,824,956 1,834,630
Office furniture ......................................... 232,800 234,830 212,487
Total ............................................. $3,314,624 $3,497,090 $3,515,763
Total OfficeMax
Office supplies and paper ................................. $3,473,430 $3,513,356 $3,555,275
Technology products ..................................... 2,800,866 2,967,124 3,020,091
Office furniture ......................................... 646,088 640,687 574,641
Total ............................................. $6,920,384 $7,121,167 $7,150,007
83