OfficeMax 2006 Annual Report Download - page 92
Download and view the complete annual report
Please find page 92 of the 2006 OfficeMax annual report below. You can navigate through the pages in the report by either clicking on the pages listed below, or by using the keyword search tool below to find specific information within the annual report.-
 1
1 -
2
-
3
-
4
-
5
-
6
-
7
-
8
-
9
-
10
-
11
-
12
-
13
-
14
-
15
-
16
-
17
-
18
-
19
-
20
-
21
-
22
-
23
-
24
-
25
-
26
-
27
-
28
-
29
-
30
-
31
-
32
-
33
-
34
-
35
-
36
-
37
-
38
-
39
-
40
-
41
-
42
-
43
-
44
-
45
-
46
-
47
-
48
-
49
-
50
-
51
-
52
-
53
-
54
-
55
-
56
-
57
-
58
-
59
-
60
-
61
-
62
-
63
-
64
-
65
-
66
-
67
-
68
-
69
-
70
-
71
-
72
-
73
-
74
-
75
-
76
-
77
-
78
-
79
-
80
-
81
-
 82
82 -
 83
83 -
 84
84 -
 85
85 -
 86
86 -
 87
87 -
 88
88 -
 89
89 -
 90
90 -
 91
91 -
 92
92 -
 93
93 -
 94
94 -
 95
95 -
 96
96 -
 97
97 -
 98
98 -
 99
99 -
 100
100 -
 101
101 -
 102
102 -
103
-
104
-
105
-
106
-
107
-
108
-
109
-
110
-
111
-
112
-
113
-
114
-
115
-
116
-
117
-
118
-
119
-
120
-
121
-
122
-
123
-
124
 |
 |

88
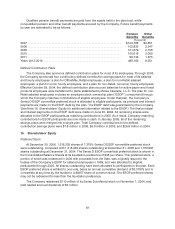
had operations inCanada and Brazil. The Company alsohad a47% interest in an oriented strand
board plant in Canada, whichwas accounted forunderthe equity method and sold in May 2004.
The following table summarizes by geography, net sales for fiscal years 2006, 2005 and 2004,
and long-lived assets at each year end:
2006 20052004
(millions)
Net sales
United States........................................... $7,617.2 $7,878.6 $ 11,986.8
Foreign................................................ 1,348.5 1,279.1 1,283.4
$8,965.7 $ 9,157.7 $ 1 3,270.2
Long-lived assets
United States........................................... $3,805.3 $4,013.5 $ 4,072.7
Foreign................................................ 313.9 316.6 323.4
$4,119.2 $ 4,330.1 $ 4,396.1