OfficeMax 2006 Annual Report Download - page 27
Download and view the complete annual report
Please find page 27 of the 2006 OfficeMax annual report below. You can navigate through the pages in the report by either clicking on the pages listed below, or by using the keyword search tool below to find specific information within the annual report.-
 1
1 -
2
-
3
-
4
-
5
-
6
-
7
-
8
-
9
-
10
-
11
-
12
-
13
-
14
-
15
-
16
-
 17
17 -
 18
18 -
 19
19 -
 20
20 -
 21
21 -
 22
22 -
 23
23 -
 24
24 -
 25
25 -
 26
26 -
 27
27 -
 28
28 -
 29
29 -
 30
30 -
 31
31 -
 32
32 -
 33
33 -
 34
34 -
 35
35 -
 36
36 -
 37
37 -
38
-
39
-
40
-
41
-
42
-
43
-
44
-
45
-
46
-
47
-
48
-
49
-
50
-
51
-
52
-
53
-
54
-
55
-
56
-
57
-
58
-
59
-
60
-
61
-
62
-
63
-
64
-
65
-
66
-
67
-
68
-
69
-
70
-
71
-
72
-
73
-
74
-
75
-
76
-
77
-
78
-
79
-
80
-
81
-
82
-
83
-
84
-
85
-
86
-
87
-
88
-
89
-
90
-
91
-
92
-
93
-
94
-
95
-
96
-
97
-
98
-
99
-
100
-
101
-
102
-
103
-
104
-
105
-
106
-
107
-
108
-
109
-
110
-
111
-
112
-
113
-
114
-
115
-
116
-
117
-
118
-
119
-
120
-
121
-
122
-
123
-
124
 |
 |
23
reorganization.Fiscal year2005 includes a $9.8 million pre-tax charge for a legal settlement with the
Department ofJustice and a $5.4 million pre-tax charge related to the restructuring of international
operations. Excluding the impact of these charges, operating expenseswere 18.2% and 19.4% of
sales for 2006 and 2005, respectively. The year-over-year improvement in operating expenses as a
percentage of sales is due to lower promotion and marketing costs as well as reduced payroll and
integration expenses.
Contract segment income increased $97.4 million to $197.7 million for 2006, or 4.2% of sales,
compared to $100.3 million, or 2.2% of sales,for 2005. Excluding the $10.3 million ofcosts related to
the Contract segment reorganization, Contract segment income was $208.0 million, or 4.4% of sales,
for 2006. Excluding the $9.8 millionlegal settlement with the Department of Justice and the $5.4
million of international restructuring charges, Contract segment income was $115.4 million, or 2.5% of
sales, for 2005.
2005 Compared With 2004
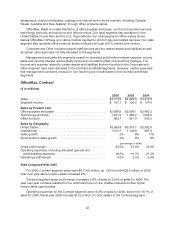
In 2005, our Contract segment had sales of $4,628.6 million, up 6% from $4,370.8 million in2004.
Year-over-year same-location sales increased 5%.
Our Contract segment gross profit margin for 2005 was 21.9% of sales, a decrease of 1.7% of
sales compared with 2004. The decrease in gross profit margin resulted fromhigher delivery costs
and changes to product mix as our Contract segmentsales shifted more towards technology and
paper products which have lower gross margins thanoffice supplies. The lower gross profit margin in
ourContract segment also reflected a more competitive pricing environmentfor large U.S. contract
customersand weaker gross profit margins inour international operations.
In 2005, operating expenses as apercentage of sales decreased 1.5% of sales to 19.7% ofsales.
Included in operating expenses for 2005 is the impactofa $9.8million legal settlement with the
Department ofJustice and a $5.4 million charge related to the restructuringof international operations.
Excluding the impact of these charges, operating expenses improved as a percentage ofsales due to
lower promotion andmarketing costs, as well as reduced payroll and integration expenses due in part
to the consolidationof our deliverycenter network. These savings were partially offset by our
investment to expand ourmiddle market sales force.
Contract segment operating income was $100.3 million, or 2.2% of sales, in 2005, down from
$107.0 million, or 2.4% ofsales, in 2004. Excluding the $9.8 million charge related to our settlement
with the Department of Justice and the $5.4 million charge related to the restructuring of international
operations, segment income increased $8.5 millionfrom the prior year. The increase was attributable
to higher sales, lower promotion and marketing costs, and reduced payroll and integration expenses,
partially offset by weaker results in Canada, lower gross margins in the U.S. and the impact of our
investment to expand ourmiddle market sales force.