OfficeMax 2006 Annual Report Download - page 66
Download and view the complete annual report
Please find page 66 of the 2006 OfficeMax annual report below. You can navigate through the pages in the report by either clicking on the pages listed below, or by using the keyword search tool below to find specific information within the annual report.-
 1
1 -
2
-
3
-
4
-
5
-
6
-
7
-
8
-
9
-
10
-
11
-
12
-
13
-
14
-
15
-
16
-
17
-
18
-
19
-
20
-
21
-
22
-
23
-
24
-
25
-
26
-
27
-
28
-
29
-
30
-
31
-
32
-
33
-
34
-
35
-
36
-
37
-
38
-
39
-
40
-
41
-
42
-
43
-
44
-
45
-
46
-
47
-
48
-
49
-
50
-
51
-
52
-
53
-
54
-
55
-
 56
56 -
 57
57 -
 58
58 -
 59
59 -
 60
60 -
 61
61 -
 62
62 -
 63
63 -
 64
64 -
 65
65 -
 66
66 -
 67
67 -
 68
68 -
 69
69 -
 70
70 -
 71
71 -
 72
72 -
 73
73 -
 74
74 -
 75
75 -
 76
76 -
77
-
78
-
79
-
80
-
81
-
82
-
83
-
84
-
85
-
86
-
87
-
88
-
89
-
90
-
91
-
92
-
93
-
94
-
95
-
96
-
97
-
98
-
99
-
100
-
101
-
102
-
103
-
104
-
105
-
106
-
107
-
108
-
109
-
110
-
111
-
112
-
113
-
114
-
115
-
116
-
117
-
118
-
119
-
120
-
121
-
122
-
123
-
124
 |
 |

62
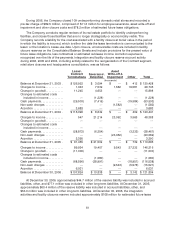
obligations, which represents the estimated fair value of the lease obligations and is net of anticipated
sublease income of approximately $109 million.
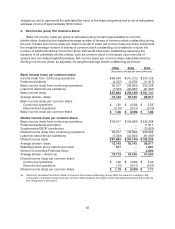
5. Net Income (Loss) Per Common Share
Basic net income (loss) per share is calculated using net earnings available to common
stockholders divided by the weighted-average number of shares ofcommon stock outstanding during
the year. Diluted net income (loss) per share is similar to basic net income (loss) per share except that
the weighted-average number ofshares of common stock outstanding is increased to include the
number of additional shares of common stock that would have been outstandingassuming the
issuance of all potentially dilutive shares, such as common stock to be issued upon exercise of
options and non-vested restricted shares. Net income (loss) per common share was determined by
dividing net income (loss), as adjusted, by weighted average shares outstanding as follows:
2006 2005 2004
(thousands, except per-share amounts)
Basic income (loss) per common share:
Income (loss) from continuing operations $ 99,054$ (41,212) $234,125
Preferred dividends (4,037) (4,378) (11,917)
Basic income(loss) from continuing operations 95,017 (45,590) 222,208
Loss from discontinued operations (7,333) (32,550) (61,067)
Basic income (loss) $ 8 7,684 $ (78,140) $161,141
Average shares—basic 73,14278,745 86,917
Basic income (loss) per common share:
Continuing operations $ 1.30 $ (0.58) $2.55
Discontinued operations (0.10) (0.41) (0.70)
Basic income (loss) per common share $ 1.20 $ (0.99) $ 1.85
Diluted income (loss) per common share:
Basic income (loss) from continuing operations $ 95,017 $ (45,590) $222,208
Preferred dividends eliminated —— 11,917
Supplemental ESOP contribution —— (10,833)
Diluted income (loss) from continuing operations 95,017 (45,590) 223,292
Loss from discontinued operations (7,333) (32,550) (61,067)
Diluted income (loss) $ 8 7,684 $ (78,140) $162,225
Average shares—basic 73,14278,745 86,917
Restricted stock, stock options and other 571 — 1,857
Series D Convertible Preferred Stock — — 2,880
Average shares—diluted (a) 73,71378,745 91,654
Diluted income (loss) per common share:
Continuing operations $ 1.29 $ (0.58) $2.44
Discontinued operations (.10) (0.41) (0.67)
Diluted income (loss) per common share $ 1.19 $ (0.99) $ 1.77
(a) Options to purchase 3.8 million shares of common stockwere outstanding during 2005, but were not included in the
computation of diluted income (loss) per common share because the impact would have been anti-dilutive due to the net
loss recognized in the period.