OfficeMax 2006 Annual Report Download - page 26
Download and view the complete annual report
Please find page 26 of the 2006 OfficeMax annual report below. You can navigate through the pages in the report by either clicking on the pages listed below, or by using the keyword search tool below to find specific information within the annual report.-
 1
1 -
2
-
3
-
4
-
5
-
6
-
7
-
8
-
9
-
10
-
11
-
12
-
13
-
14
-
15
-
 16
16 -
 17
17 -
 18
18 -
 19
19 -
 20
20 -
 21
21 -
 22
22 -
 23
23 -
 24
24 -
 25
25 -
 26
26 -
 27
27 -
 28
28 -
 29
29 -
 30
30 -
 31
31 -
 32
32 -
 33
33 -
 34
34 -
 35
35 -
 36
36 -
37
-
38
-
39
-
40
-
41
-
42
-
43
-
44
-
45
-
46
-
47
-
48
-
49
-
50
-
51
-
52
-
53
-
54
-
55
-
56
-
57
-
58
-
59
-
60
-
61
-
62
-
63
-
64
-
65
-
66
-
67
-
68
-
69
-
70
-
71
-
72
-
73
-
74
-
75
-
76
-
77
-
78
-
79
-
80
-
81
-
82
-
83
-
84
-
85
-
86
-
87
-
88
-
89
-
90
-
91
-
92
-
93
-
94
-
95
-
96
-
97
-
98
-
99
-
100
-
101
-
102
-
103
-
104
-
105
-
106
-
107
-
108
-
109
-
110
-
111
-
112
-
113
-
114
-
115
-
116
-
117
-
118
-
119
-
120
-
121
-
122
-
123
-
124
 |
 |

22
salespeople, outbound telesales, catalogs, the Internet and in some markets, including Canada,
Hawaii,Australia and New Zealand, through office products stores.
OfficeMax, Retail is a retail distributor of office supplies and paper, print and document services,
technology products and solutions and office furniture. Our retail segment has operations in the
United States, Puerto Rico and the U.S. Virgin Islands. Our retail segment’soffice supply stores
feature OfficeMax ImPress, an in-store module devoted to print-for-payand related services. Our retail
segment also operates office products stores in Mexico through a 51%-owned joint venture.
Corporate and Other includes support staff services and the related assetsand liabilities as well
as certain other expensesnot fully allocated to the segments.
Management evaluates the segments based on operating profit before interest expense, income
taxes and minority interest, extraordinaryitems and cumulative effect of accounting changes. The
income and expense related to certainassets and liabilities that are reported in theCorporate and
Other segment have been allocated to the Contract and Retail segments. However, certain expenses
that management considers unusual or non-recurring are not allocated to the Contractand Retail
segments.
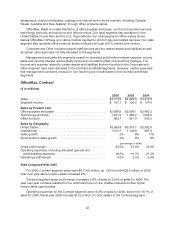
OfficeMax, Contract
($ in millions)
2006 2005 2004
Sales.................................................... $4,714.5 $4,628.6 $ 4,370.8
Segmentincome. ......................................... $197.7 $100.3 $ 107.0
Sales by Product Line
Office supplies and paper.................................. $2,568.9$2,598.1 $ 2,463.2
Technology products ...................................... 1,551.9 1,469.2 1,404.6
Office furniture. ........................................... 593.7 561.3 503.0
Sales by Geography
United States............................................. $3,559.8 $3,519.7 $ 3 ,382.9
International.............................................. 1,154.7 1,108.9 987.9
Sales growth ............................................. 2% 6% 17%
Same-location sales growth ................................ 2% 5% 8%
(percentage of sales)
Gross profit margin. ....................................... 22.5% 21.9% 23.6%
Operating expenses, including allocated general and
administrative expenses ................................. 18.3% 19.7% 21.2%
Operating profit margin.................................... 4.2% 2.2% 2.4%
2006 Compared With 2005
For 2006, Contract segmentsales were $4,714.5 million, up1.9% from $4,628.6 million in 2005.
Year-over-year same-location sales increased 2%.
Contract segment gross profit margin increased 0.6% of sales to 22.5% of sales for 2006. The
year-over-year increase resulted from a continued focus on the middle-market and other higher
margin salesopportunities.
Operating expenses for the Contract segment were 18.3% of sales for 2006, down from 19.7% of
sales for 2005. Fiscal year 2006includes $10.3 million of costs related to the Contract segment