OfficeMax 2006 Annual Report Download - page 18
Download and view the complete annual report
Please find page 18 of the 2006 OfficeMax annual report below. You can navigate through the pages in the report by either clicking on the pages listed below, or by using the keyword search tool below to find specific information within the annual report.-
 1
1 -
2
-
3
-
4
-
5
-
6
-
7
-
 8
8 -
 9
9 -
 10
10 -
 11
11 -
 12
12 -
 13
13 -
 14
14 -
 15
15 -
 16
16 -
 17
17 -
 18
18 -
 19
19 -
 20
20 -
 21
21 -
 22
22 -
 23
23 -
 24
24 -
 25
25 -
 26
26 -
 27
27 -
 28
28 -
29
-
30
-
31
-
32
-
33
-
34
-
35
-
36
-
37
-
38
-
39
-
40
-
41
-
42
-
43
-
44
-
45
-
46
-
47
-
48
-
49
-
50
-
51
-
52
-
53
-
54
-
55
-
56
-
57
-
58
-
59
-
60
-
61
-
62
-
63
-
64
-
65
-
66
-
67
-
68
-
69
-
70
-
71
-
72
-
73
-
74
-
75
-
76
-
77
-
78
-
79
-
80
-
81
-
82
-
83
-
84
-
85
-
86
-
87
-
88
-
89
-
90
-
91
-
92
-
93
-
94
-
95
-
96
-
97
-
98
-
99
-
100
-
101
-
102
-
103
-
104
-
105
-
106
-
107
-
108
-
109
-
110
-
111
-
112
-
113
-
114
-
115
-
116
-
117
-
118
-
119
-
120
-
121
-
122
-
123
-
124
 |
 |

14
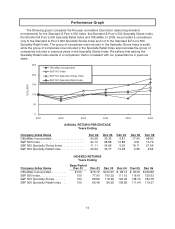
Performance Graph
The following graph compares the five-year cumulative total return (assuming dividend
reinvestment) for the Standard & Poor’s500 Index, the Standard & Poor’s 500 Specialty Stores Index,
the Standard & Poor’s 500 Specialty Retail Index and OfficeMax. In 2005,weprovided a comparison
only to the Standard & Poor’s 500Specialty Stores Index andnot to the Standard & Poor’s500
Specialty Retail Index.The group ofcompanies now included in the Specialty Stores Index is small,
while the group of companies now included in the Specialty Retail Index approximates the group of
companies included inprevious years in the Specialty Stores Index. We believe that adding the
Specialty Retail Index results in a comparison that is consistent with ourpresentations in previous
years.
0
50
100
150
200
250
2001 2002 2003 2004 2005 2006
DOLLARS
OfficeMax Incorporated
S&P 500 Index
S&P 500 Specialty Stores Index
S&P 500 Specialty Retail Index
ANNUAL RETURN PERCENTAGE
Years Ending
Company\Index Name Dec 02 Dec 03 Dec 04 Dec 05 Dec 06
OfficeMax Incorporated ...................... -24.28 33.33-2.81 -17.54 98.80
S&P 500 Index. ............................. -22.10 28.6810.88 4.91 15.79
S&P 500Specialty Stores Index. .............. -11.11 34.665.20 18.11 21.56
S&P 500Specialty Retail Index............... -33.52 45.7712.28 2.86 6.64
INDEXED RETURNS
Years Ending
Company\Index Name
Base Period
Dec 01 Dec 02 Dec 03 Dec 04 Dec 05 Dec 06
OfficeMax Incorporated .......... $ 100 $ 75.72$ 1 00.97 $ 98.13 $80.91 $ 1 60.86
S&P 500 Index. ................. 100 77.90 100.25 111.15 116.61 135.03
S&P 500Specialty Stores ........ 100 88.89 119.69 125.92 148.72 180.78
S&P 500Specialty Retail Index... 100 66.48 96.92 108.82 111.94 119.37