OfficeMax 2006 Annual Report Download - page 28
Download and view the complete annual report
Please find page 28 of the 2006 OfficeMax annual report below. You can navigate through the pages in the report by either clicking on the pages listed below, or by using the keyword search tool below to find specific information within the annual report.-
 1
1 -
2
-
3
-
4
-
5
-
6
-
7
-
8
-
9
-
10
-
11
-
12
-
13
-
14
-
15
-
16
-
17
-
 18
18 -
 19
19 -
 20
20 -
 21
21 -
 22
22 -
 23
23 -
 24
24 -
 25
25 -
 26
26 -
 27
27 -
 28
28 -
 29
29 -
 30
30 -
 31
31 -
 32
32 -
 33
33 -
 34
34 -
 35
35 -
 36
36 -
 37
37 -
 38
38 -
39
-
40
-
41
-
42
-
43
-
44
-
45
-
46
-
47
-
48
-
49
-
50
-
51
-
52
-
53
-
54
-
55
-
56
-
57
-
58
-
59
-
60
-
61
-
62
-
63
-
64
-
65
-
66
-
67
-
68
-
69
-
70
-
71
-
72
-
73
-
74
-
75
-
76
-
77
-
78
-
79
-
80
-
81
-
82
-
83
-
84
-
85
-
86
-
87
-
88
-
89
-
90
-
91
-
92
-
93
-
94
-
95
-
96
-
97
-
98
-
99
-
100
-
101
-
102
-
103
-
104
-
105
-
106
-
107
-
108
-
109
-
110
-
111
-
112
-
113
-
114
-
115
-
116
-
117
-
118
-
119
-
120
-
121
-
122
-
123
-
124
 |
 |

24
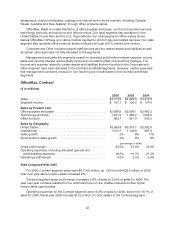
OfficeMax, Retail
($ in millions)
2006 2005 2004
Sales................................................... $4,251.2 $ 4,529.1 $4,481.3
Segment income......................................... $86.3$27.9 $ 22.7
Sales by Product Line
Office supplies and paper................................. $1,585.9 $ 1,639.6 $1,768.4
Technology products..................................... 2,210.8 2,363.5 2,308.0
Office furniture........................................... 454.5526.0 404.9
Sales by Geography
United States(a) ......................................... $4,057.4 $ 4,358.9 $4,327.9
International............................................. 193.8 170.2 153.4
Sales growth (2004 is pro-forma). .......................... (6.1)%1.1% (0.9)%
Same-location sales growth ............................... 0.1% (1.0)% 1.3%
(percentage of sales)
Gross profit margin. ...................................... 29.3%26.2% 25.6%
Operating expenses, including allocated general and
administrative expenses ................................ 27.3%25.6% 25.1%
Operating profit margin................................... 2.0% 0.6% 0.5%
(a) Includes our operations in the United States, Puerto Rico and the U.S. Virgin Islands.
2006 Compared With 2005
Retail segment sales were $4,251.2 million for 2006 compared to $4,529.1 millionfor 2005. Retail
segment sales were lower due to the impact of the 109 strategic store closings during the first quarter
of 2006 and the 53 rd week included in 2005 results. Retail segment same-location sales increased
0.1% year-over-year during 2006. During 2006, we opened 44 new retail stores in the U.S., ending the
period with 859 retail stores inthe U.S. Our majority owned joint-venture inMexico opened 12 stores
during 2006, ending the year with55stores.
Retail segment gross margin increased 3.1% of sales to 29.3% ofsales for2006, from 26.2% of
sales for 2005. The gross margin improvementwas primarily due to the segment’s improved
promotional and advertising strategies and reduced inventory shrinkageand inventory clearance,
year-over-year.
Retail segment operating expenseswere 27.3% of sales for 2006 compared to 25.6%for 2005.
During 2006, the Retail segmentincurred pre-tax charges of$89.5 million related to the closure of 109
underperforming retail stores. In 2005, the Retail segment incurred asset impairmentcharges of $17.9
million primarily related to the store closures. Excluding the impact of these charges, Retail segment
operating expenses were 25.2% of sales for both 2006 and 2005. Operating expenses for 2006
benefited from targeted cost reductions, including reduced store labor and marketing costs. These
improvements were offset by an increase in allocated general and administrative expenses
during 2006.
For 2006, the Retail segment reported operating incomeof$86.3 million, or 2.0% of sales,
compared to operating income of $27.9 million, or 0.6% of sales, in 2005. Excluding the impact of the
store closing related charges for both years, Retail segment operating income for 2006 was $175.8
million, or 4.1% of sales,compared to $45.8 million, or 1.0% of sales for 2005.