OfficeMax 2006 Annual Report Download - page 34
Download and view the complete annual report
Please find page 34 of the 2006 OfficeMax annual report below. You can navigate through the pages in the report by either clicking on the pages listed below, or by using the keyword search tool below to find specific information within the annual report.-
 1
1 -
2
-
3
-
4
-
5
-
6
-
7
-
8
-
9
-
10
-
11
-
12
-
13
-
14
-
15
-
16
-
17
-
18
-
19
-
20
-
21
-
22
-
23
-
 24
24 -
 25
25 -
 26
26 -
 27
27 -
 28
28 -
 29
29 -
 30
30 -
 31
31 -
 32
32 -
 33
33 -
 34
34 -
 35
35 -
 36
36 -
 37
37 -
 38
38 -
 39
39 -
 40
40 -
 41
41 -
 42
42 -
 43
43 -
 44
44 -
45
-
46
-
47
-
48
-
49
-
50
-
51
-
52
-
53
-
54
-
55
-
56
-
57
-
58
-
59
-
60
-
61
-
62
-
63
-
64
-
65
-
66
-
67
-
68
-
69
-
70
-
71
-
72
-
73
-
74
-
75
-
76
-
77
-
78
-
79
-
80
-
81
-
82
-
83
-
84
-
85
-
86
-
87
-
88
-
89
-
90
-
91
-
92
-
93
-
94
-
95
-
96
-
97
-
98
-
99
-
100
-
101
-
102
-
103
-
104
-
105
-
106
-
107
-
108
-
109
-
110
-
111
-
112
-
113
-
114
-
115
-
116
-
117
-
118
-
119
-
120
-
121
-
122
-
123
-
124
 |
 |
30
Liquidity and Capital Resources
As of December 30, 2006, we had $282.1 million of cash and cash equivalents and $409.9 million
of short-termand long-term debt, excluding the$1.5billion of timber securitization notes. We also had
$22.3 million of restricted investments on deposit which are pledged to secure a portion of the
outstanding debt. During 2006, we reduced our netdebt (total debt excluding the timber securitization
notes less cash and restricted investments) by approximately $295million. Since the end of 2003, we
have paid down approximately $1.9 billion of debt,primarily with proceeds from the sale of the paper,
forest products and timberland assets, and expensed $151.5million ofcosts related to the early
retirement of debt. During 2004,weannounced planstoreturnbetween $800 million and $1 billion of
the Sale proceeds to shareholdersvia common or preferred stock buybacks, cash dividends or a
combination of these alternatives. As part of thiscommitment to return cash to equity-holders, we
redeemed $110 million of our Series D preferred stock on November 1, 2004. Additionally, during the
second quarter of 2005, we repurchased 23.5 million shares ofour common stock andthe associated
common stock purchase rights through amodified Dutch auctiontender offer at a purchase price of
$775.5 million, or $33.00per share, plus transaction costs.
Our ratio of current assets to current liabilities was 1.37:1 at December 30,2006, compared with
1.22:1 at December 31, 2005. The increase in our ratio ofcurrent a ssets to current liabilities at
December 30, 2006 resulted primarily from the increase in cash and cash equivalents in 2006. During
2006, we generated cash flow from operations of $375.7 million, whichmore than offset cash used for
capital expenditures. In addition, we received proceeds from stock option exercises of approximately
$130 million during 2006.
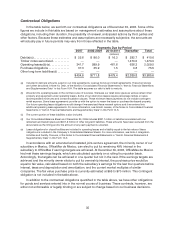
Our primary ongoing cash requirements relate to working capital, expenditures for property a nd
equipment, lease obligations and debt service.We expect to fund these requirements through a
combination of cash flow from operations and seasonal borrowings under our revolving credit facility.
The sections that follow discuss in more detail ouroperating, investing, and financing activities, as
well as our financing arrangements.
Operating Activities
Our operatingactivitiesgenerated $375.7 million of cash in 2006 andused $57.7 million of cash
in 2005 and $451.1 million of cash in 2004. In 2006, items included in net income provided
$270.1 million of cash, and favorable changes in working capital items provided $105.6 million. Cash
provided from working capital changes includes the effects of reduced accounts receivable and
improved accounts payable-to-inventory leverage.In2005, items included in net income (loss)
provided $170.1 million of cash, and unfavorable changes in working capital items used
$227.8 million. Included in networking capital changes during 2005 were net income tax payments of
$134.1 million primarily related to gains recognized in 2004. Other working capital changes in 2005
included a reduction in accounts payable and accrued liabilities partially offset by improved accounts
receivable and inventory levels. In 2004, items included in net income provided $280.9 millionof cash
and unfavorable changes in workingcapital items used $732.0 million of cash from operations.
We have sold fractional ownership interests in a defined pool of trade accounts receivable. At
December 30, 2006, December 31, 2005 and December 31, 2004, $180.0 million, $163.0 million and
$120.0 million, respectively, of sold accounts receivable were excluded from Receivables inour
ConsolidatedBalance Sheet.Cash flow from operations in 2006 and 2005 benefited from increases in
the amount of receivables sold under thisprogram by $17.0 million and $43.0 million, respectively.
During the third quarter of 2004,inanticipation of the Sale, we stopped selling the receivables related
to the Boise Building Solutions and Boise Paper Solutionssegments, reducing the receivables sold as