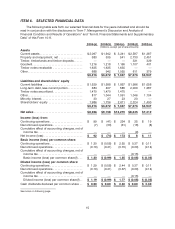
OfficeMax 2006 Annual Report Download - page 24
Download and view the complete annual report
Please find page 24 of the 2006 OfficeMax annual report below. You can navigate through the pages in the report by either clicking on the pages listed below, or by using the keyword search tool below to find specific information within the annual report.-
 1
1 -
2
-
3
-
4
-
5
-
6
-
7
-
8
-
9
-
10
-
11
-
12
-
13
-
 14
14 -
 15
15 -
 16
16 -
 17
17 -
 18
18 -
 19
19 -
 20
20 -
 21
21 -
 22
22 -
 23
23 -
 24
24 -
 25
25 -
 26
26 -
 27
27 -
 28
28 -
 29
29 -
 30
30 -
 31
31 -
 32
32 -
 33
33 -
 34
34 -
35
-
36
-
37
-
38
-
39
-
40
-
41
-
42
-
43
-
44
-
45
-
46
-
47
-
48
-
49
-
50
-
51
-
52
-
53
-
54
-
55
-
56
-
57
-
58
-
59
-
60
-
61
-
62
-
63
-
64
-
65
-
66
-
67
-
68
-
69
-
70
-
71
-
72
-
73
-
74
-
75
-
76
-
77
-
78
-
79
-
80
-
81
-
82
-
83
-
84
-
85
-
86
-
87
-
88
-
89
-
90
-
91
-
92
-
93
-
94
-
95
-
96
-
97
-
98
-
99
-
100
-
101
-
102
-
103
-
104
-
105
-
106
-
107
-
108
-
109
-
110
-
111
-
112
-
113
-
114
-
115
-
116
-
117
-
118
-
119
-
120
-
121
-
122
-
123
-
124
 |
 |
20
of domestic and foreign sources of income. Income tax expense in 2005 was alsoimpacted by an
increase inthe valuation allowance for certain state net operating losses.
As a result ofthe foregoing factors, we reported income from continuing operations of $99.1
million, or $1.29 per diluted share, for2006, compared to a loss from continuing operations of $41.2
million, or $(0.58) per diluted share, for 2005. Including the loss from discontinued operations, the net
income for 2006 was $91.7 million, or $1.19diluted share compared with a net loss of $73.8 million,or
$0.99per diluted share in 2005. Excluding the effect of the Additional Consideration Agreement
adjustment, the charges for store closures, contract segment reorganization and our headquarters
consolidation, income from continuing operations was $159.2 million, or $2.10 per diluted share, for
2006.Excluding the charges for the write-down of impaired assets of certain retail stores, our legal
settlement with the Department of Justice,severance and professional fees, international restructuring
and our headquarters consolidation, we recognized income from continuing operations of $23.6
million, or $0.24 per diluted share, for2005.
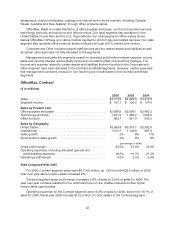
2005 Compared with 2004
In 2005, sales were $9,157.7 million, compared with $13,270.2 million in 2004.The sales decline
in 2005 wasprimarily due to the sale of our Boise Building Solutions and Boise Paper Solutions
segments that were included in 2004 but not in 2005.Substantially all of the assets of these segments,
along with our timberland assets, were included in the Sale.
Gross profit margin improved 3.8% of sales to 24.0% of sales for 2005 compared to 20.2% of
sales for the previous year. The year-over-year variance was largely attributable to the Sale.The
Contract and Retail segments operate with higher gross margins than did the Boise Building Solutions
and Boise Paper Solutions segments.
Operating and selling expenses increased by 4.1% of sales to 19.3% ofsales in 2005 from 15.2%
of sales for thesame period a year earlier. The year-over-year variance waslargely attributable to the
Sale.The Contract and Retail segments operate with higher operating and selling expenses than the
Boise Building Solutions and Boise Paper Solutions segments.
General and administrative expenses as a percent of sales increased to 4.0% in 2005 from 2.8% in
2004.General and administrative expenses in 2005included $24.2 million of expenses for one-time
severance payments and other expenses, primarily professional service fees, which are not expected
to be ongoing.Excluding the severance and other expenses, general and administrative expenses
were 3.6% ofsales for 2005.
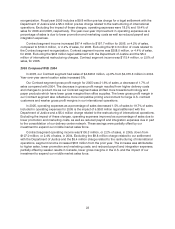
In 2005, we reported $54.0 million of expense in Other operating, net, including $25.0 million of
expenses related to the relocationand consolidation of our corporate headquarters, $23.2 millionof
expenses for the write-down of impaired assets at underperforming retail stores and the restructuring
of our Canadian operations and a $9.8 million charge related to alegal settlement with the
Department ofJustice. In 2004, we reported $370.6 millionof income in Other operating, net,
including a $280.6 million gain onthe Sale, a $46.5 million pre-tax gain on the sale of Voyageur Panel,
a $75.0 million pre-taxgain on the sale oftimberlands, offset by approximately $18.9million ofcosts
related to theSale, $8.9 million ofintegration and facility closure costs, and$7.1 million of costs
related to thesale of our Yakima, Washington plywood and lumber facilities. Other operating, net
includes dividends received on our investment in affiliates of Boise Cascade L.L.C.and equity in net
income of affiliates whichwere $5.5 million in 2005 and $6.3million in 2004 including equity in the
earnings of Voyageur Panel. We sold our interest in Voyageur Panel in May 2004. (See Note 6, Other
Operating,Net, of the Notes to ConsolidatedFinancial Statements in “Item 8.Financial Statements
and Supplementary Data” of this Form 10-K for additional information related to the components of
Other Operating, net.) An additional $180million gainon the Sale was deferred as a result of our