OfficeMax 2006 Annual Report Download - page 22
Download and view the complete annual report
Please find page 22 of the 2006 OfficeMax annual report below. You can navigate through the pages in the report by either clicking on the pages listed below, or by using the keyword search tool below to find specific information within the annual report.-
 1
1 -
2
-
3
-
4
-
5
-
6
-
7
-
8
-
9
-
10
-
11
-
 12
12 -
 13
13 -
 14
14 -
 15
15 -
 16
16 -
 17
17 -
 18
18 -
 19
19 -
 20
20 -
 21
21 -
 22
22 -
 23
23 -
 24
24 -
 25
25 -
 26
26 -
 27
27 -
 28
28 -
 29
29 -
 30
30 -
 31
31 -
 32
32 -
33
-
34
-
35
-
36
-
37
-
38
-
39
-
40
-
41
-
42
-
43
-
44
-
45
-
46
-
47
-
48
-
49
-
50
-
51
-
52
-
53
-
54
-
55
-
56
-
57
-
58
-
59
-
60
-
61
-
62
-
63
-
64
-
65
-
66
-
67
-
68
-
69
-
70
-
71
-
72
-
73
-
74
-
75
-
76
-
77
-
78
-
79
-
80
-
81
-
82
-
83
-
84
-
85
-
86
-
87
-
88
-
89
-
90
-
91
-
92
-
93
-
94
-
95
-
96
-
97
-
98
-
99
-
100
-
101
-
102
-
103
-
104
-
105
-
106
-
107
-
108
-
109
-
110
-
111
-
112
-
113
-
114
-
115
-
116
-
117
-
118
-
119
-
120
-
121
-
122
-
123
-
124
 |
 |

18
•In 2004, we completed the sale of our paper, forest products and timberland assets (the “Sale”)
and recorded a $280.6 million pre-tax gain. We monetized the timber installment notes we
received in exchange for our timberlands for proceeds of $1.5 billion in December 2004, and
recognized $19 million in expenses related tothe change in thefair value of interest rate swaps
we entered into in anticipation of thesecuritizationtransaction. We used a portion of the
proceeds from the Sale toreduce our debt, and recorded $137.1 million ofcosts related to the
early retirement ofdebt. Our results for 2004 also include a pre-tax gainof$59.9 million on the
sale of approximately 79,000 acres of timberland located inwestern Louisiana, and a pre-tax
gain of $46.5 million on the sale of our 47% interest in Voyageur Panel, as well as a
$67.8 million pre-tax charge for the write-down of impaired assets at our Elma, Washington,
manufacturing facility.
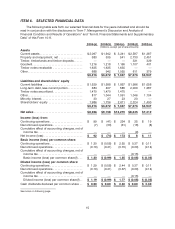
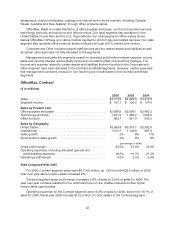
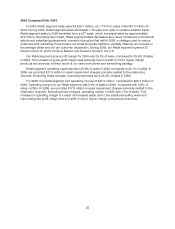
Results of Operations, Consolidated
($ in millions, except per share amounts)
2006 2005 2004
Sales.................................................. $8,965.7 $ 9 ,157.7 $13,270.2
Income (loss) from continuing operations before incometaxes
and minority interest................................... $171.9 $(37.6) $379.4
Net income (loss)....................................... $91.7$(73.8) $ 173.1
Diluted income (loss) per common share
Continuing operations................................. $1. 29 $(0.58) $2.44
Discontinued operations............................... (0.10) (0.41) (0.67)
Diluted income (loss) per common share ................ $ 1.19$ (0.99 ) $1.77
(percentage ofsales)
Gross profit margin. ..................................... 25.8%24.0% 20.2%
Operating and selling expenses........................... 18.3%19.3% 15.2%
General andadministrative expenses ...................... 4.0% 4.0% 2.8%
Other operating, net..................................... 1.6% 0.6% (2.9)%
Operating profit margin.................................. 1.9% 0.1% 5.1%
Operating Results
2006 Compared with 2005
Sales for 2006 decreased 2.1% to $8,965.7 million from $9,157.7 million for 2005. The year-over-
year sales decrease was primarily due to the impact of 109 strategic store closings in the first quarter
of 2006 and the 53 rd week included in the 2005 Retail segment results. Comparable-store sales
increased 1.0% year-over-year primarily as a result of higher sales in our Contract segment. For more
information about our segment results, see the discussion of segment results below.
Gross profit margin improved 1.8% of sales to 25.8% ofsales in 2006 compared to 24.0% ofsales
in the previous year. The gross profitmargin increase was driven by gross margin improvement
initiativesin both the Contract and Retail segments.
Operating and selling expenses decreased by 1.0% of sales to 18.3% of sales in2006 from 19.3%
of sales a year earlier. The improvement in operating and selling expenses as a percent of sales was
theresult of targeted cost reduction programs, including lower promotion and marketing costs,