OfficeMax 2006 Annual Report Download - page 53
Download and view the complete annual report
Please find page 53 of the 2006 OfficeMax annual report below. You can navigate through the pages in the report by either clicking on the pages listed below, or by using the keyword search tool below to find specific information within the annual report.-
 1
1 -
2
-
3
-
4
-
5
-
6
-
7
-
8
-
9
-
10
-
11
-
12
-
13
-
14
-
15
-
16
-
17
-
18
-
19
-
20
-
21
-
22
-
23
-
24
-
25
-
26
-
27
-
28
-
29
-
30
-
31
-
32
-
33
-
34
-
35
-
36
-
37
-
38
-
39
-
40
-
41
-
42
-
 43
43 -
 44
44 -
 45
45 -
 46
46 -
 47
47 -
 48
48 -
 49
49 -
 50
50 -
 51
51 -
 52
52 -
 53
53 -
 54
54 -
 55
55 -
 56
56 -
 57
57 -
 58
58 -
 59
59 -
 60
60 -
 61
61 -
 62
62 -
 63
63 -
64
-
65
-
66
-
67
-
68
-
69
-
70
-
71
-
72
-
73
-
74
-
75
-
76
-
77
-
78
-
79
-
80
-
81
-
82
-
83
-
84
-
85
-
86
-
87
-
88
-
89
-
90
-
91
-
92
-
93
-
94
-
95
-
96
-
97
-
98
-
99
-
100
-
101
-
102
-
103
-
104
-
105
-
106
-
107
-
108
-
109
-
110
-
111
-
112
-
113
-
114
-
115
-
116
-
117
-
118
-
119
-
120
-
121
-
122
-
123
-
124
 |
 |

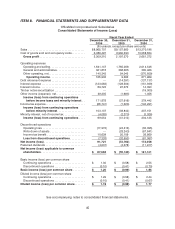
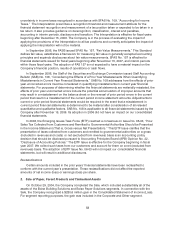
See accompanying notes to consolidated financial statements.
49
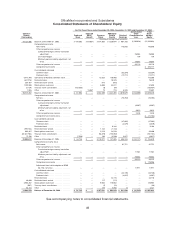
OfficeMax Incorporated and Subsidiaries
Consolidated Statements of Shareholders’ Equity
For the Fiscal Years ended December 30, 2006, December 31, 2005 and December31, 2004
Common
Shares
Outstanding
Preferred
Stock
Deferred
ESOP
Benefit
Common
Stock
Additional
Paid-In
Capital
Retained
Earnings
Accumulated
Other
Comprehensive
Loss
Total
Share-
holders’
Equity
(thousands, except share amounts)
87,137,306Balance at December 31,2003.......... $185,302$(19,087) $ 214,805$1,228,694$907,738$(193,818 ) $ 2,323,634
Comprehensive income
Net income. .....................————173,058 — 173,058
Othercomprehensive income
Cumulativeforeign currency translation
adjustment ...................——— — —29,933 29,933
Cash flow hedges. ............... —— ———159 159
Minimum pension liability adjustment, net
of tax.......................——— — —19,027 19,027
Othercomprehensive income.........——— — —49,119 49,119
Comprehensive income............. $ 222,177
Cash dividends declared
Commonstock ...................————(52,284) — (52,284)
Preferred stock ...................——— —(12,211) — (12,211)
5,412,705 Conversion of ACES to common stock. ....——13,532158,968 —— 172,500
(547,275) Restricted stock....................———19,579 ——
19,579
365,787 Restricted stock vested............... ——915(915) —— —
1,202,308 Stockoptions exercised. .............. ——3,00634,817— — 37,823
(3,129) Treasury stock cancellations ............ (123,338)— (8)(91)— — (123,437)
7,855 Other ........................... —19,08719213 3,378— 22,697
93,575,557Balance at December31, 2004.......... $61,964$ —$ 232,269 $1,441, 265$1,019,679$(144,699 ) $ 2,610,478
Comprehensive income
Net loss ........................——— —(73,762) — (73,762)
Othercomprehensive income
Cumulativeforeign currency translation
adjustment ...................——— — —
(6,037 ) (6,037)
Minimum pension liability adjustment, net
of tax.......................——— — —8,615 8,615
Othercomprehensive income.........——— — —2,578 2,578
Comprehensive income (loss).........$ (71,184)
Cash dividends declared
Commonstock ...................————(47,082) — (47,082)
Preferred stock ...................——— —(4,379) — (4,379)
Restricted stock....................———9,184— — 9,184
(199,134) Restricted stock vested............... ——1,134(1,134) —— —
883,817 Stockoptions exercised. .............. ——2,21024,250— — 26,460
(23,527,764) Treasury stock cancellations ............ ——(58,819) (722,362)— — (781,181)
72,136 Other........................... (7,229)—183 (3,398) 3,827—
(6,617)
70,804,612 Balance at December31, 2005.......... $54,735$ —$ 176,977 $747,805 $898,283 $(142,121 ) $ 1,735,679
Comprehensive income (loss)
Net income. .....................————91,721— 91,721
Othercomprehensive income
Cumulativeforeign currency translation
adjustment ...................——— — —11,581 11,581
Minimum pension liability adjustment, net
of tax.......................——— — —26,634 26,634
Othercomprehensive income.........——— — —38,215 38,215
Comprehensive income............. $ 129,936
Adjustment from initial adoption of SFAS
No. 158, net oftax................ —— ———11,911 11,911
Cash dividends declared
Commonstock ...................————(44,136) — (44,136)
Preferred stock ...................——— —(4,037) — (4,037)
Restricted stock....................———24,116 —— 24,116
46,940 Restricted stock vested............... ——117(117) —— —
3,993,857 Stockoptions exercised. .............. ——9,985119,982 ——
129,967
(907) Treasury stock cancellations ............ —— (2)(31)— — (33)
58,718 Other........................... ——1492,093 (1) — 2,241
74,903,220 Balance atDecember 30, 2006 .........$54,735 $— $ 1 87,226 $ 893,848 $ 941,830 $ (91,995) $1,985,644