OfficeMax 2006 Annual Report Download - page 49
Download and view the complete annual report
Please find page 49 of the 2006 OfficeMax annual report below. You can navigate through the pages in the report by either clicking on the pages listed below, or by using the keyword search tool below to find specific information within the annual report.-
 1
1 -
2
-
3
-
4
-
5
-
6
-
7
-
8
-
9
-
10
-
11
-
12
-
13
-
14
-
15
-
16
-
17
-
18
-
19
-
20
-
21
-
22
-
23
-
24
-
25
-
26
-
27
-
28
-
29
-
30
-
31
-
32
-
33
-
34
-
35
-
36
-
37
-
38
-
 39
39 -
 40
40 -
 41
41 -
 42
42 -
 43
43 -
 44
44 -
 45
45 -
 46
46 -
 47
47 -
 48
48 -
 49
49 -
 50
50 -
 51
51 -
 52
52 -
 53
53 -
 54
54 -
 55
55 -
 56
56 -
 57
57 -
 58
58 -
 59
59 -
60
-
61
-
62
-
63
-
64
-
65
-
66
-
67
-
68
-
69
-
70
-
71
-
72
-
73
-
74
-
75
-
76
-
77
-
78
-
79
-
80
-
81
-
82
-
83
-
84
-
85
-
86
-
87
-
88
-
89
-
90
-
91
-
92
-
93
-
94
-
95
-
96
-
97
-
98
-
99
-
100
-
101
-
102
-
103
-
104
-
105
-
106
-
107
-
108
-
109
-
110
-
111
-
112
-
113
-
114
-
115
-
116
-
117
-
118
-
119
-
120
-
121
-
122
-
123
-
124
 |
 |

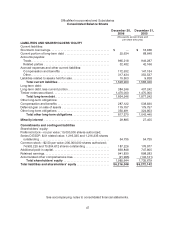
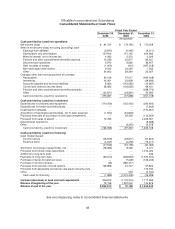
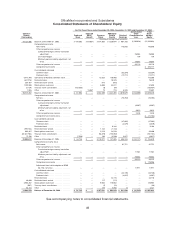
See accompanying notes to consolidated financial statements.
45
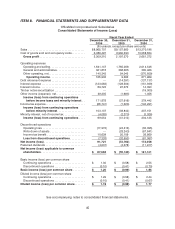
ITEM 8. FINANCIAL STATEMENTS AND SUPPLEMENTARY DATA
OfficeMax Incorporated and Subsidiaries
Consolidated Statements ofIncome (Loss)
Fiscal Year Ended
December 30,
2006
December 31,
2005
December 31,
2004
(thousands, except per-share amounts)
Sales ....................................... $ 8 ,965,707 $ 9 ,157,660 $ 1 3,270,196
Cost of goods sold and occupancy costs ......... 6,656,497 6,960,390 10,588,824
Gross profit ............................... 2,309,210 2,197,270 2,681,372
Operating expenses
Operating and selling. ....................... 1,641,147 1,765,268 2,014,546
General and administrative ................... 361,818 368,265 365,466
Other operating, net ......................... 140,343 54,045 (370,609)
Operating income ........................ 165,902 9,692 671,969
Debt retirement expense ....................... — (14,391 ) (137,137)
Interest expense ..............................(123,082) (128,504
) (151,939)
Interest income ............................... 89,723 97,272 14,093
Timber notessecuritization ..................... — —(19,000)
Other income (expense), net.................... 39,335 (1,685
) 1,456
Income (loss) from continuing operations
before income taxes and minority interest .. 171,878 (37,616 ) 379,442
Income tax expense ........................... (68,741) (1,226 ) (142,291)
Income (loss) from continuing operations
before minority interest................... 103,137 (38,842
) 237,151
Minority interest, net of income tax............... (4,083) (2,370 ) (3,026)
Income (loss) from continuing operations .... 99,054 (41,212 ) 234,125
Discontinued operations
Operating loss. ............................. (17,972) (24,416 ) (32,095)
Write-down of assets ........................ — (28,243 ) (67,841)
Income tax benefit .......................... 10,639 20,109 38,869
Loss from discontinued operations .......... (7,333) (32,550 ) (61,067)
Net income (loss) ............................ 91,721 (73,762) 173,058
Preferred dividends ........................... (4,037) (4,378 ) (11,917)
Net income (loss) applicable to common
shareholders.............................. $87,684 $ (78,140) $161,141
Basic income (loss) per common share
Continuing operations....................... $ 1.30 $ (0.58) $ 2.55
Discontinued operations..................... (0.10) (0.41) (0.70)
Basic income (loss) per common share ........ $ 1.20 $ (0.99)$ 1.85
Diluted income (loss) per common share
Continuing operations....................... $ 1.29 $ (0.58) $ 2.44
Discontinued operations..................... (0.10) (0.41) (0.67)
Diluted income (loss) per common share ....... $ 1.19 $ (0.99)$ 1.77