OfficeMax 2006 Annual Report Download - page 116
Download and view the complete annual report
Please find page 116 of the 2006 OfficeMax annual report below. You can navigate through the pages in the report by either clicking on the pages listed below, or by using the keyword search tool below to find specific information within the annual report.-
 1
1 -
2
-
3
-
4
-
5
-
6
-
7
-
8
-
9
-
10
-
11
-
12
-
13
-
14
-
15
-
16
-
17
-
18
-
19
-
20
-
21
-
22
-
23
-
24
-
25
-
26
-
27
-
28
-
29
-
30
-
31
-
32
-
33
-
34
-
35
-
36
-
37
-
38
-
39
-
40
-
41
-
42
-
43
-
44
-
45
-
46
-
47
-
48
-
49
-
50
-
51
-
52
-
53
-
54
-
55
-
56
-
57
-
58
-
59
-
60
-
61
-
62
-
63
-
64
-
65
-
66
-
67
-
68
-
69
-
70
-
71
-
72
-
73
-
74
-
75
-
76
-
77
-
78
-
79
-
80
-
81
-
82
-
83
-
84
-
85
-
86
-
87
-
88
-
89
-
90
-
91
-
92
-
93
-
94
-
95
-
96
-
97
-
98
-
99
-
100
-
101
-
102
-
103
-
104
-
105
-
 106
106 -
 107
107 -
 108
108 -
 109
109 -
 110
110 -
 111
111 -
 112
112 -
 113
113 -
 114
114 -
 115
115 -
 116
116 -
 117
117 -
 118
118 -
 119
119 -
 120
120 -
 121
121 -
 122
122 -
 123
123 -
 124
124
 |
 |

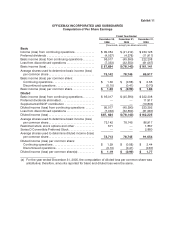
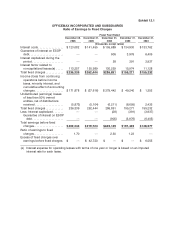
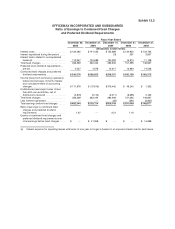
Exhibit 11
OFFICEMAX INCORPORATED AND SUBSIDIARIES
Computation of Per Share Earnings
Fiscal Year Ended
December 30,
2006
December 31,
2005
December 31,
2004
(thousands, except per-share amounts)
Basic
Income (loss) fromcontinuing operations............. $99,054$(41,212) $234,125
Preferred dividends ................................ (4,037)(4,378) (11,917)
Basic income (loss) from continuing operations ........ 95,017 (45,590) 222,208
Loss from discontinued operations ................... (7,333)(32,550) (61,067)
Basic income (loss)................................ $87,684 $ (78,140) $161,141
Average shares used todetermine basic income (loss)
per common share............................... 73,142 78,745 86,917
Basic income (loss) per common share:
Continuing operations............................$1.30 $(0.58) $ 2.55
Discontinued operations.......................... (0. 10)(0.41) (0.70)
Basic income (loss)per common share............... $1.20 $ (0.99) $1.85
Diluted
Basic income (loss) from continuing operations ........ $95,017$(45,590) $222,208
Preferred dividends eliminated....................... ——11,917
Supplemental ESOP contribution ....................— —(10,833)
Dilutedincome (loss) from continuing operations......95,017(45,590) 223,292
Loss from discontinued operations ................... (7,333)(32,550) (61,067)
Diluted income (loss) ............................... $87, 684 $ (78,140) $162,225
Average shares used todetermine basic income (loss)
per common share............................... 73,14278,745 86,917
Restricted stock,stockoptions andother ............. 571—1,857
Series D Convertible PreferredStock.................— —2,880
Average shares used todetermine diluted income (loss)
per common share............................... 73,713 78,745 91,654
Diluted income (loss) per common share:
Continuing operations............................$1.29 $(0.58) $ 2.44
Discontinued operations.......................... (0.10) (0.41) (0.67)
Diluted income (loss) per commonshare(a) ........... $1.19 $ (0.99) $1.77
(a) For the year ended December 31, 2005, the computation of diluted loss per common share was
antidilutive; therefore, amounts reported for basic and diluted loss were the same.