MoneyGram 2005 Annual Report Download - page 98
Download and view the complete annual report
Please find page 98 of the 2005 MoneyGram annual report below. You can navigate through the pages in the report by either clicking on the pages listed below, or by using the keyword search tool below to find specific information within the annual report.-
 1
1 -
2
-
3
-
4
-
5
-
6
-
7
-
8
-
9
-
10
-
11
-
12
-
13
-
14
-
15
-
16
-
17
-
18
-
19
-
20
-
21
-
22
-
23
-
24
-
25
-
26
-
27
-
28
-
29
-
30
-
31
-
32
-
33
-
34
-
35
-
36
-
37
-
38
-
39
-
40
-
41
-
42
-
43
-
44
-
45
-
46
-
47
-
48
-
49
-
50
-
51
-
52
-
53
-
54
-
55
-
56
-
57
-
58
-
59
-
60
-
61
-
62
-
63
-
64
-
65
-
66
-
67
-
68
-
69
-
70
-
71
-
72
-
73
-
74
-
75
-
76
-
77
-
78
-
79
-
80
-
81
-
82
-
83
-
84
-
85
-
86
-
87
-
 88
88 -
 89
89 -
 90
90 -
 91
91 -
 92
92 -
 93
93 -
 94
94 -
 95
95 -
 96
96 -
 97
97 -
 98
98 -
 99
99 -
 100
100 -
 101
101 -
 102
102 -
 103
103 -
 104
104 -
 105
105 -
 106
106 -
 107
107 -
 108
108 -
109
-
110
-
111
-
112
-
113
-
114
-
115
-
116
-
117
-
118
-
119
-
120
-
121
-
122
-
123
-
124
-
125
-
126
-
127
-
128
-
129
-
130
-
131
-
132
-
133
-
134
-
135
-
136
-
137
-
138
-
139
-
140
-
141
-
142
-
143
-
144
-
145
-
146
-
147
-
148
-
149
-
150
-
151
-
152
-
153
-
154
-
155
 |
 |

Table of Contents
MONEYGRAM INTERNATIONAL, INC. AND SUBSIDIARIES
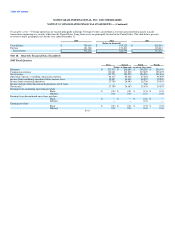
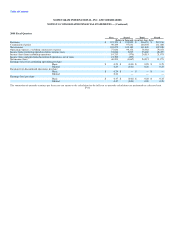
NOTES TO CONSOLIDATED FINANCIAL STATEMENTS — (Continued)
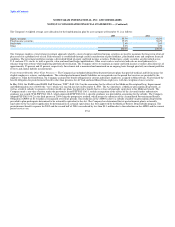
2004 Fiscal Quarters
First Second Third Fourth
(Dollars in thousands, except per share data)
Revenues $ 191,321 $ 199,820 $ 216,153 $ 219,236
Commission expense 90,249 97,631 104,305 111,288
Net revenues 101,072 102,189 111,848 107,948
Operating expenses, excluding commission expense 77,026 99,172 78,388 79,451
Income from continuing operations before income taxes 24,046 3,017 33,460 28,497
Income (loss) from continuing operations 19,213 (570) 24,515 21,971
Income (loss) and gain from discontinued operations, net of taxes 21,780 (497) — —
Net income (loss) 40,993 (1,067) 24,515 21,971
Earnings (loss) from continuing operations per share
Basic $ 0.23 $ (0.01) $ 0.28 $ 0.25
Diluted 0.23 (0.01) 0.28 0.25
Earnings from discontinued operations per share
Basic $ 0.24 $ — $ — $ —
Diluted 0.24 — — —
Earnings (loss) per share
Basic $ 0.47 $ (0.01) $ 0.28 $ 0.25
Diluted 0.47 (0.01) 0.28 0.25
The summation of quarterly earnings per share may not equate to the calculation for the full year as quarterly calculations are performed on a discrete basis.
F-44