MoneyGram 2005 Annual Report Download - page 32
Download and view the complete annual report
Please find page 32 of the 2005 MoneyGram annual report below. You can navigate through the pages in the report by either clicking on the pages listed below, or by using the keyword search tool below to find specific information within the annual report.-
 1
1 -
2
-
3
-
4
-
5
-
6
-
7
-
8
-
9
-
10
-
11
-
12
-
13
-
14
-
15
-
16
-
17
-
18
-
19
-
20
-
21
-
 22
22 -
 23
23 -
 24
24 -
 25
25 -
 26
26 -
 27
27 -
 28
28 -
 29
29 -
 30
30 -
 31
31 -
 32
32 -
 33
33 -
 34
34 -
 35
35 -
 36
36 -
 37
37 -
 38
38 -
 39
39 -
 40
40 -
 41
41 -
 42
42 -
43
-
44
-
45
-
46
-
47
-
48
-
49
-
50
-
51
-
52
-
53
-
54
-
55
-
56
-
57
-
58
-
59
-
60
-
61
-
62
-
63
-
64
-
65
-
66
-
67
-
68
-
69
-
70
-
71
-
72
-
73
-
74
-
75
-
76
-
77
-
78
-
79
-
80
-
81
-
82
-
83
-
84
-
85
-
86
-
87
-
88
-
89
-
90
-
91
-
92
-
93
-
94
-
95
-
96
-
97
-
98
-
99
-
100
-
101
-
102
-
103
-
104
-
105
-
106
-
107
-
108
-
109
-
110
-
111
-
112
-
113
-
114
-
115
-
116
-
117
-
118
-
119
-
120
-
121
-
122
-
123
-
124
-
125
-
126
-
127
-
128
-
129
-
130
-
131
-
132
-
133
-
134
-
135
-
136
-
137
-
138
-
139
-
140
-
141
-
142
-
143
-
144
-
145
-
146
-
147
-
148
-
149
-
150
-
151
-
152
-
153
-
154
-
155
 |
 |

Table of Contents
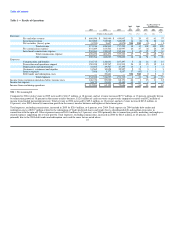
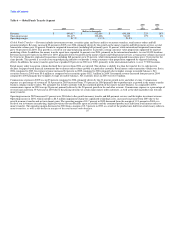
Outlook
We believe that the following key items will have an impact on our future operations. In 2006, we expect:
• Net revenue (total revenue less total commissions) to be in the range of $535 million to $560 million.
• Net investment margin to be in the range of 155 to 165 basis points. Average portfolio balances are expected to be in the range of $6.3 - $6.6 billion for the
year.
• Income from continuing operations before tax to be in the range of $147 million to $155 million.
• Diluted earnings per share to be in the range of $1.25 to $1.30.
These expectations include the expensing of stock options, which we began at the beginning of 2005. This guidance is dependent on a variety of factors,
including those referred to under "Forward Looking Statements." From time to time, events may occur which can result in unanticipated income or losses.
Our outlook does not reflect such events.
LIQUIDITY AND CAPITAL RESOURCES
One of our primary financial goals is to maintain adequate liquidity to manage the fluctuations in the balances of payment service assets and obligations
resulting from sales of official checks, money orders and other payment instruments, the timing of the collections of receivables, and the timing of the
presentment of such instruments for payment. In addition, we strive to maintain adequate liquidity for capital expenditures and other normal operating cash
needs.
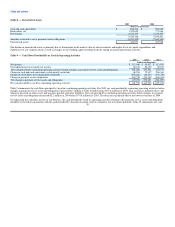
At December 31, 2005, we had cash and cash equivalents of $866.4 million, net receivables of $1,325.6 million and investments of $6,233.3 million, all
substantially restricted for payment service obligations. We rely on the funds from ongoing sales of payment instruments and portfolio cash flows to settle
payment service obligations as they are presented. Due to the continuous nature of the sales and settlement of our payment instruments, we are able to invest
in securities with a longer term than the average life of our payment instruments.
We are regulated by various state agencies, which generally require us to maintain liquid assets and investments with a rating of A or higher, in an amount
generally equal to the payment service obligation for regulated payment instruments (teller checks, agent checks, money orders and money transfers). We are
not regulated by state agencies for our payment service obligations resulting from outstanding cashier's checks; however, we restrict the funds related to these
payment instruments due to contractual arrangements and/or Company policy. Accordingly, assets restricted for regulatory or contractual reasons, and by
Company policy are not available to satisfy working capital or other financing requirements. In addition, our Company policy limits our investment in below
investment grade securities and non-rated securities to 2.5 percent of our total investments and cash equivalents. As of December 31, 2005, we are in
compliance with this policy. In February 2006, this policy was revised to 3.0 percent of our total investments.
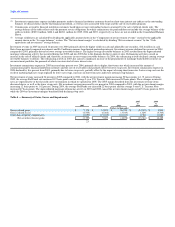
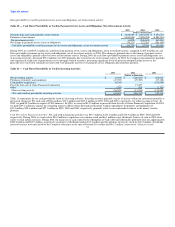
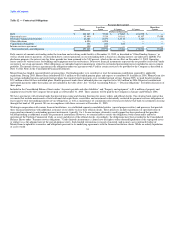
As of December 31, 2005 and 2004, we had unrestricted cash and cash equivalents, receivables, and investments to the extent those assets exceed all payment
service obligations as summarized in Table 8. These amounts are generally available; however, management considers a portion of these amounts as
providing additional assurance that regulatory requirements are maintained during the normal fluctuations in the value of investments.
29